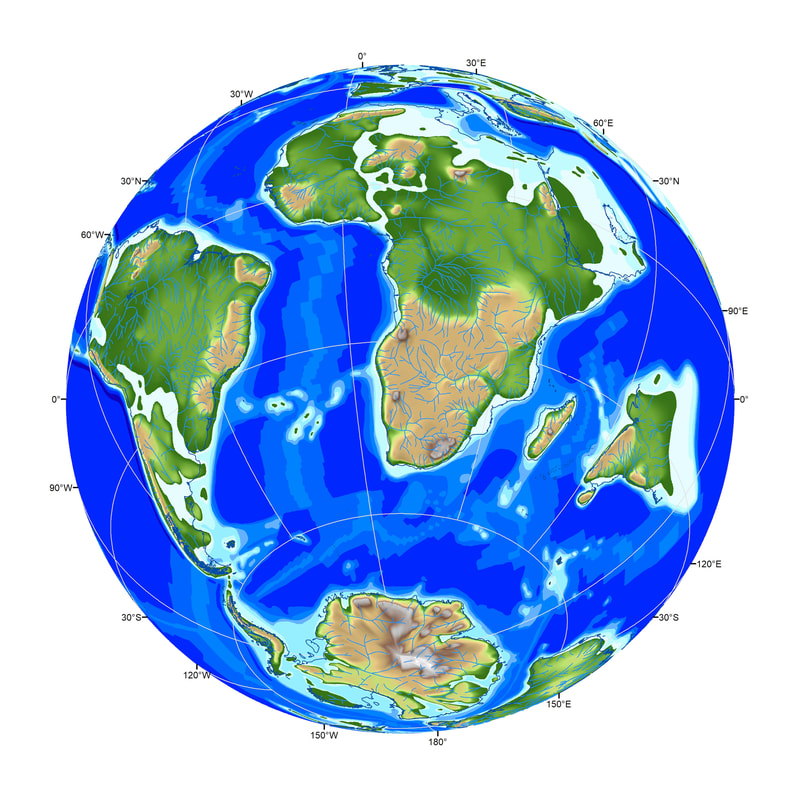
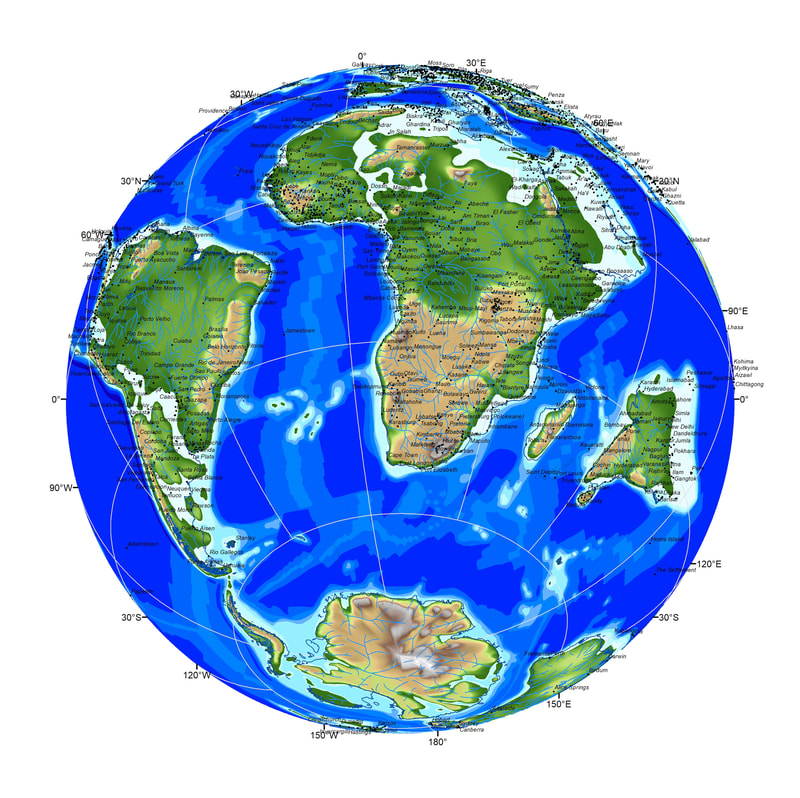
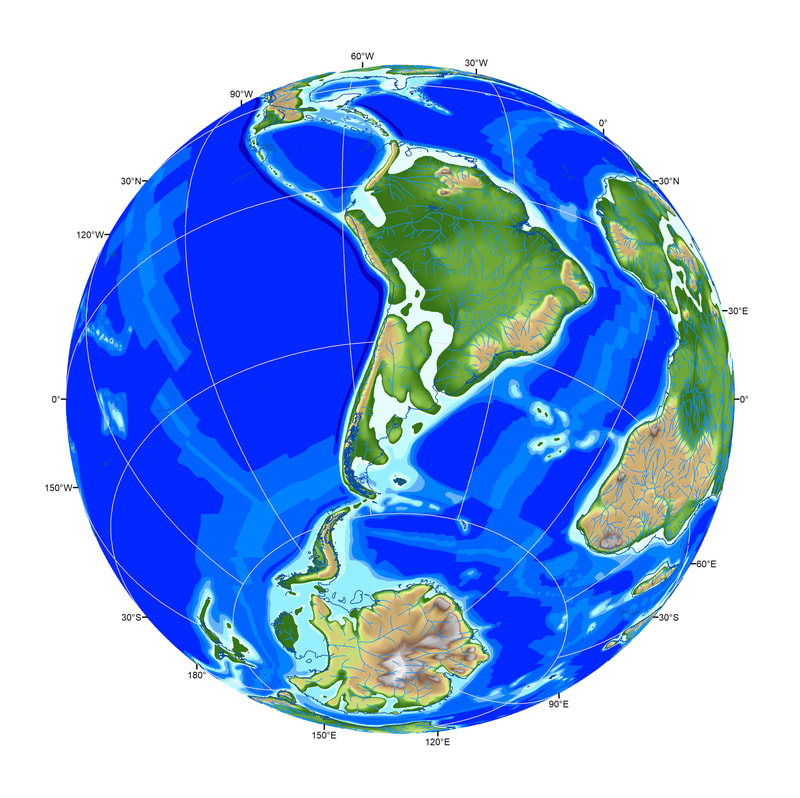
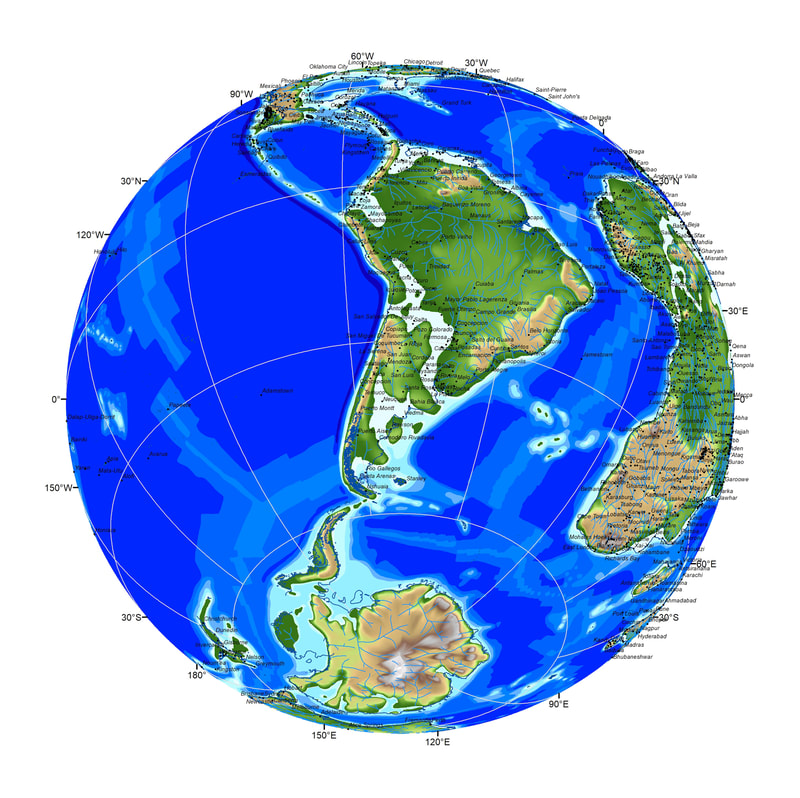
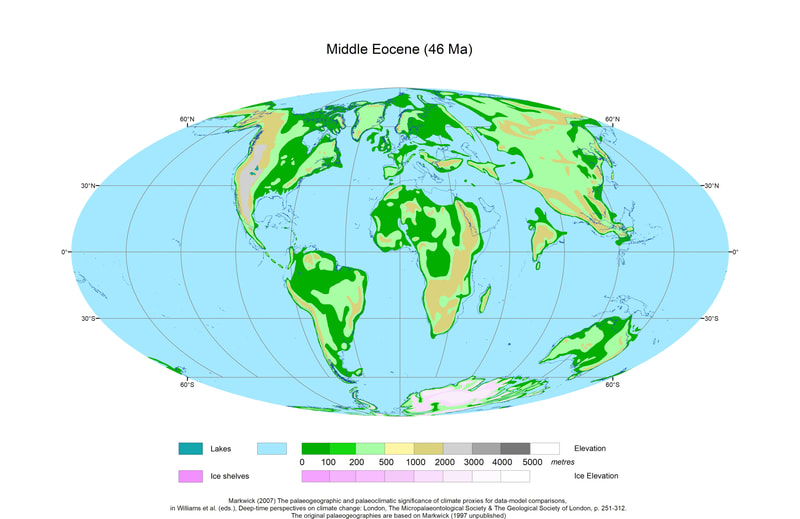
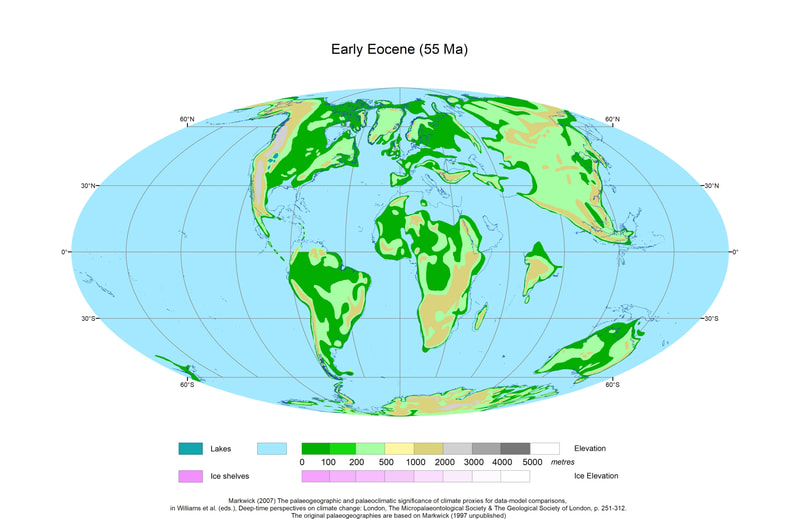
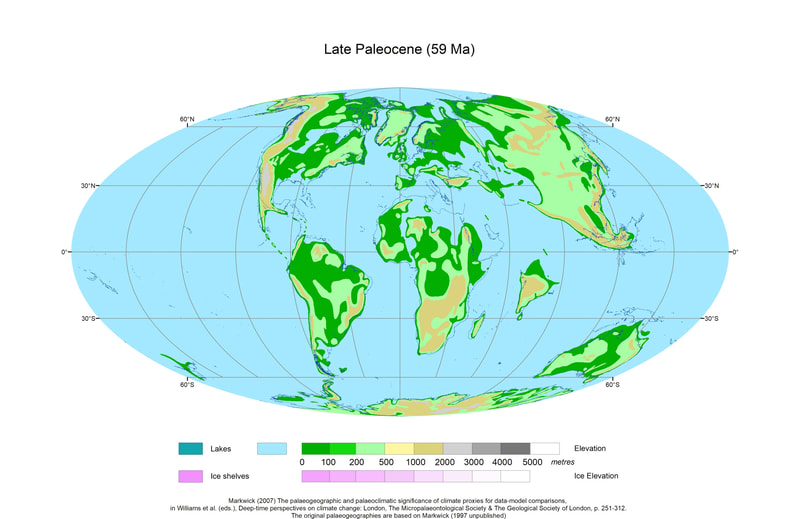
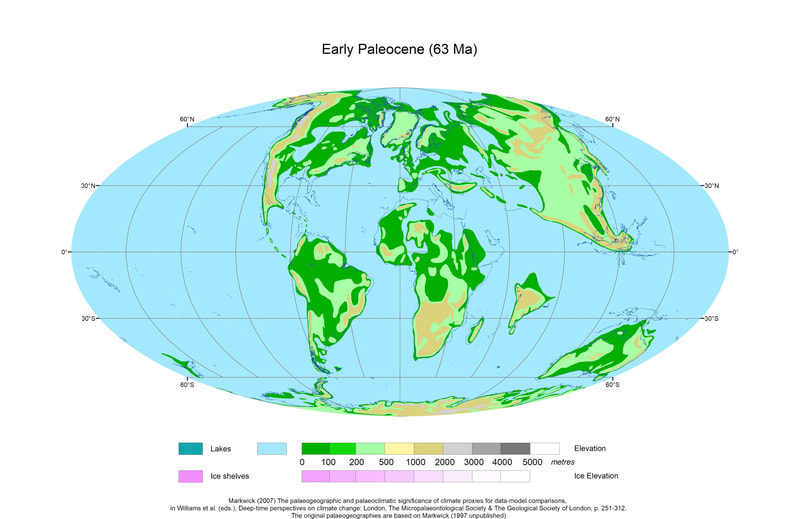
The Knowing Earth website and Paul Markwick’s research website, Paul's Palaeo Pages, contain many images, maps and figures that can be downloaded.
With the repeated lockdowns of 2020 and now 2021 we have received numerous requests for, especially, paleogeographic map images. So, to help on this we have now set up galleries of imagery which we will be expanding over the next few months.
These are aimed at helping students, but may be of use to explorationists, teachers and other decision makers.
Images are provided in jpeg format and have been designed so that included captions and recommended citations can be cropped out if needed – after long experience of using internet material and knowing how people use images in their presentations and projects. We do ask that you cite images accordingly.
If you have suggestions or requests for new material, or if you need alternative image formats, please do contact us: [email protected]
Paleogeography Maps (based on methods in Markwick & Valdes 2004)
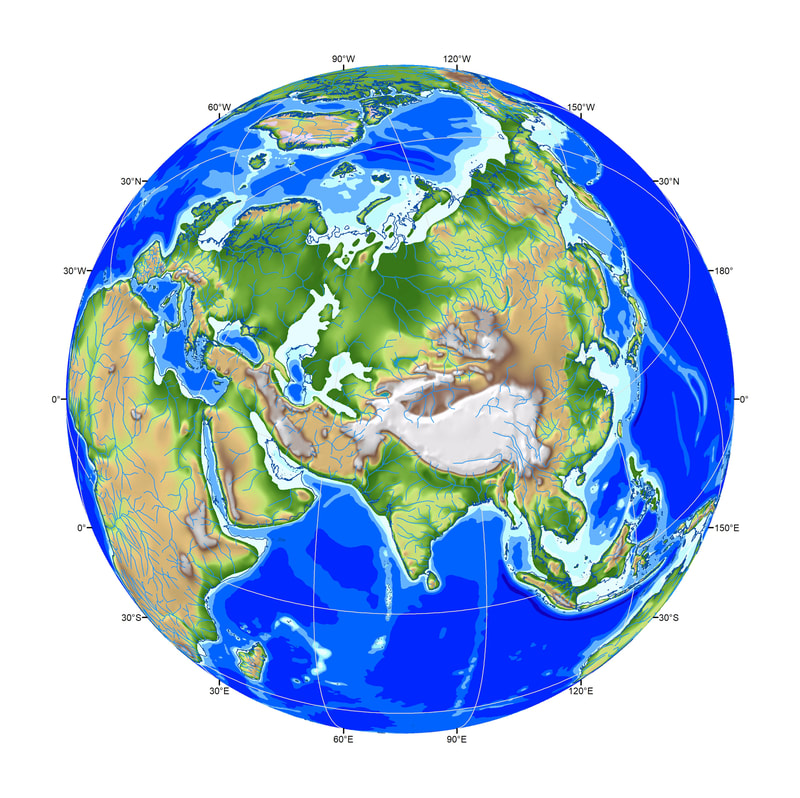
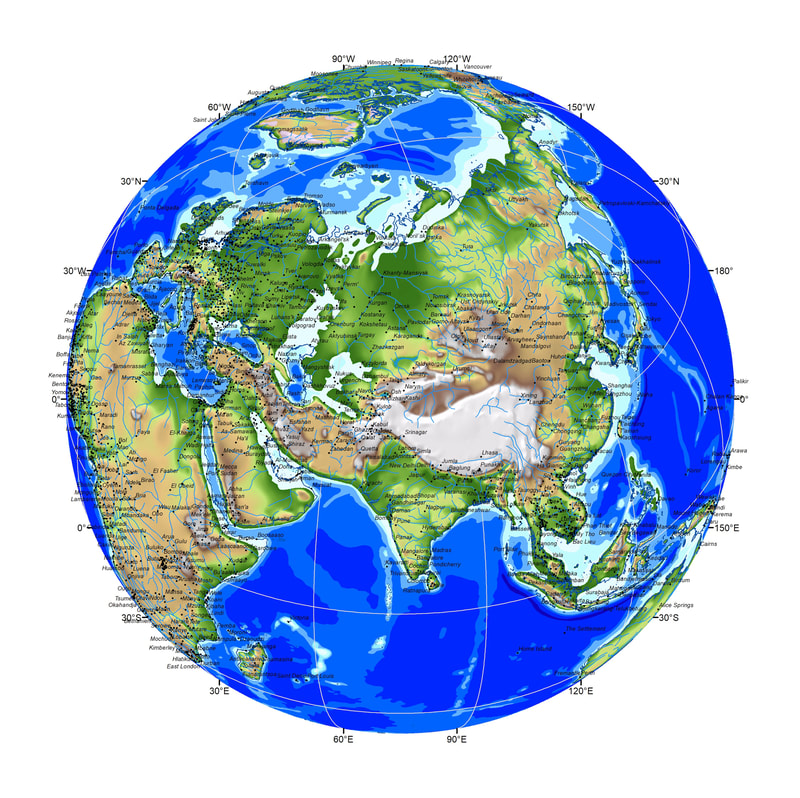
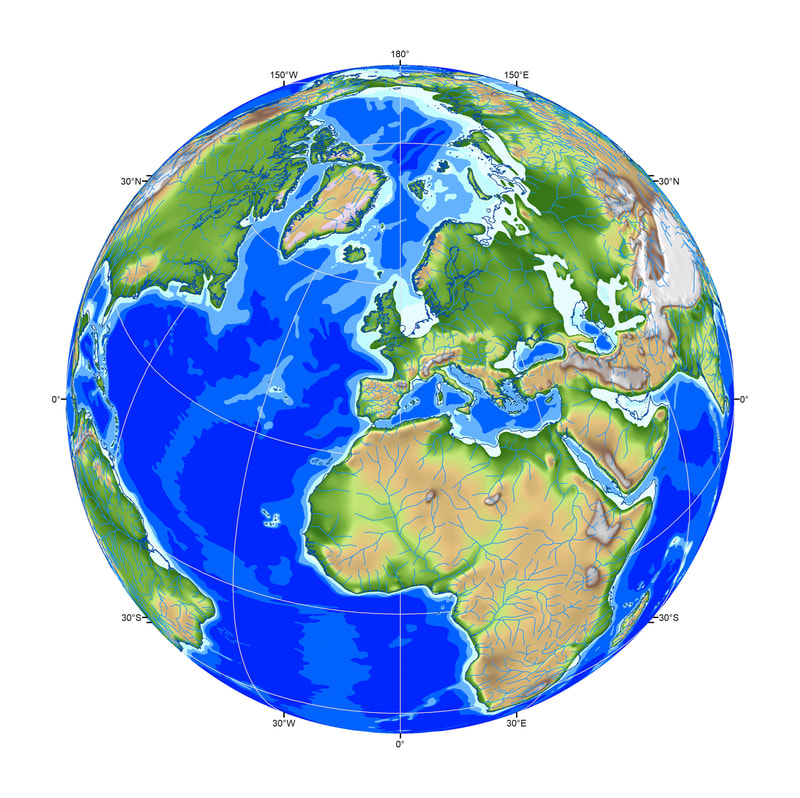
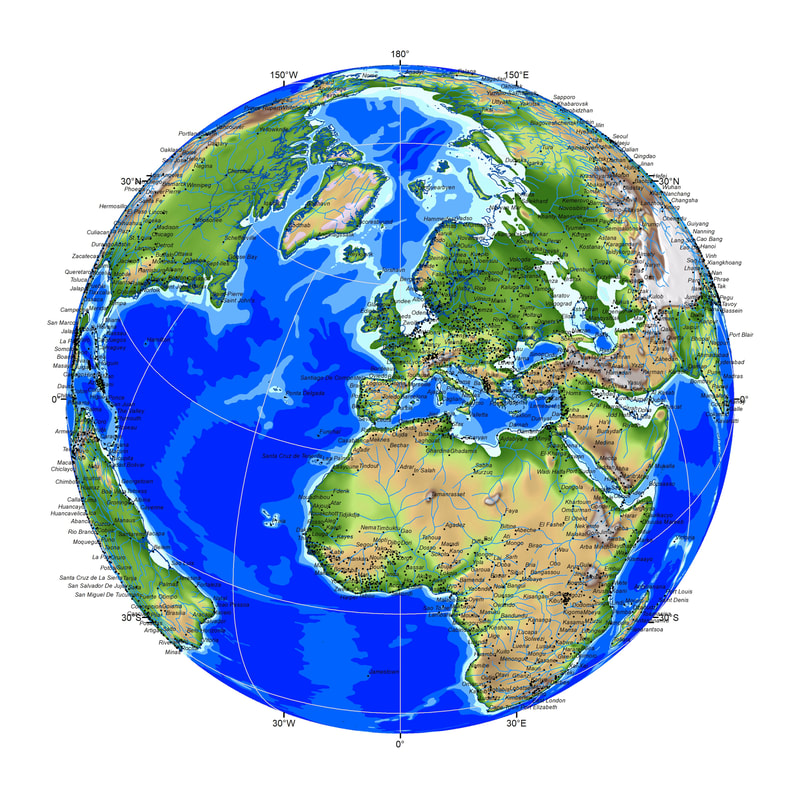
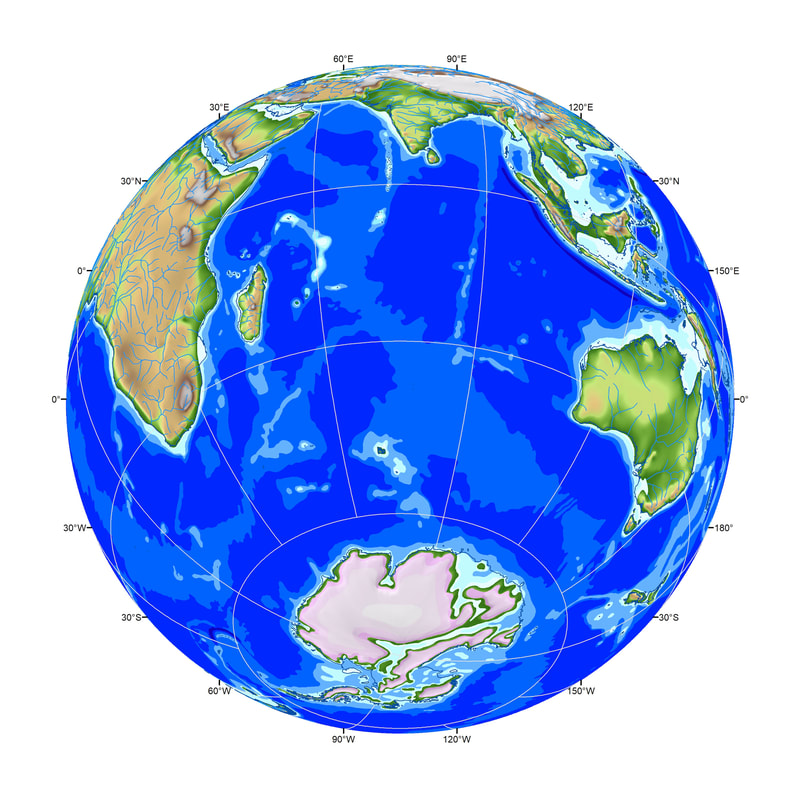
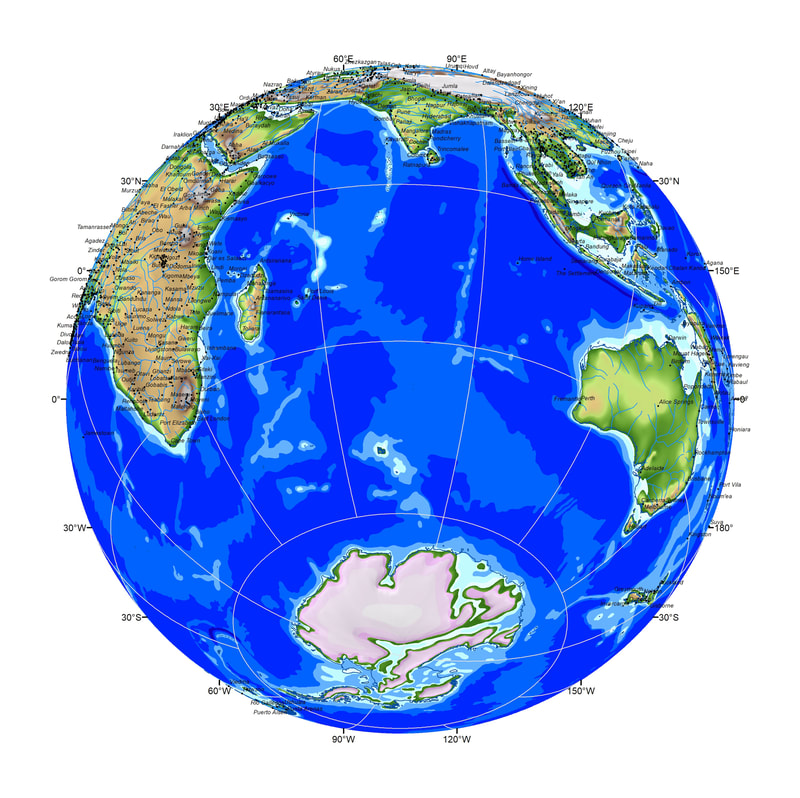
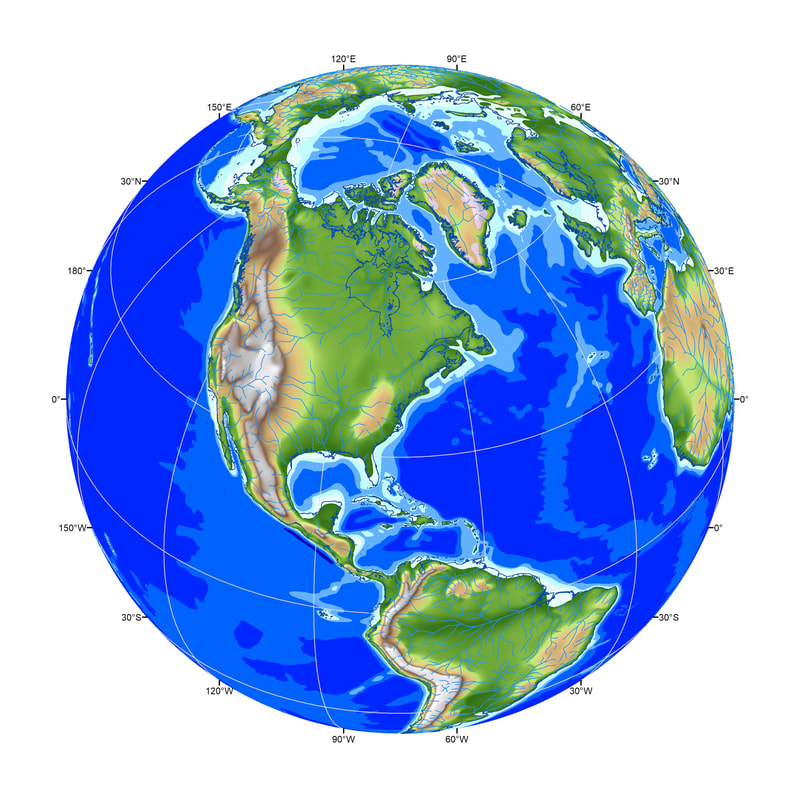
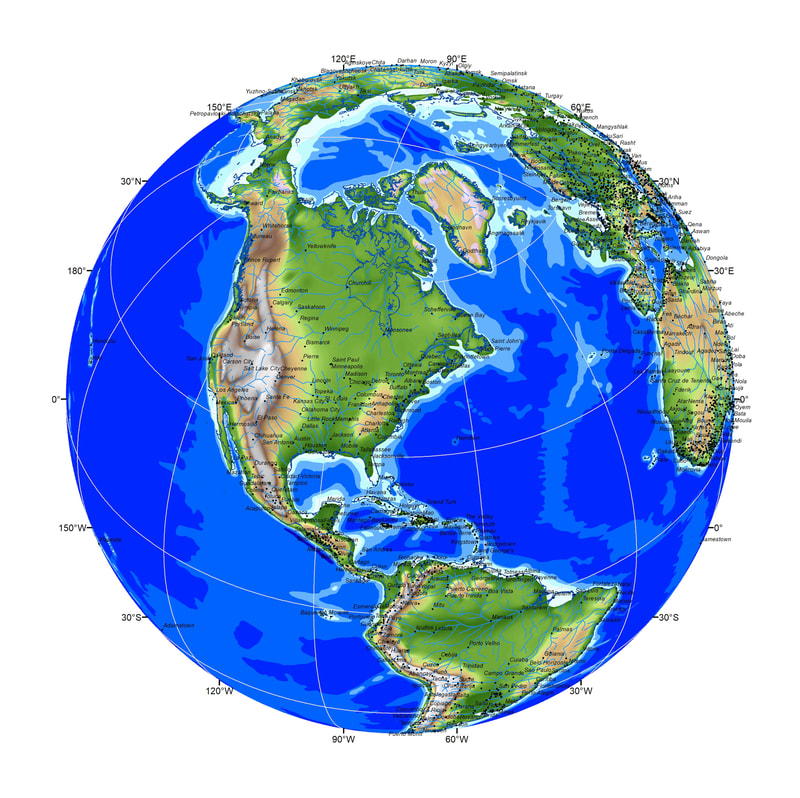
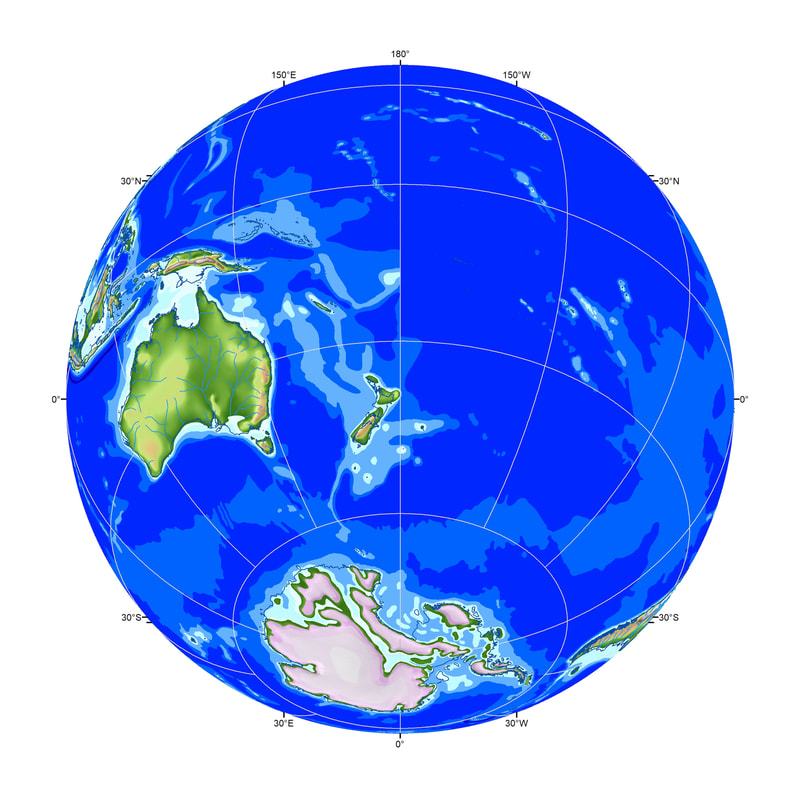
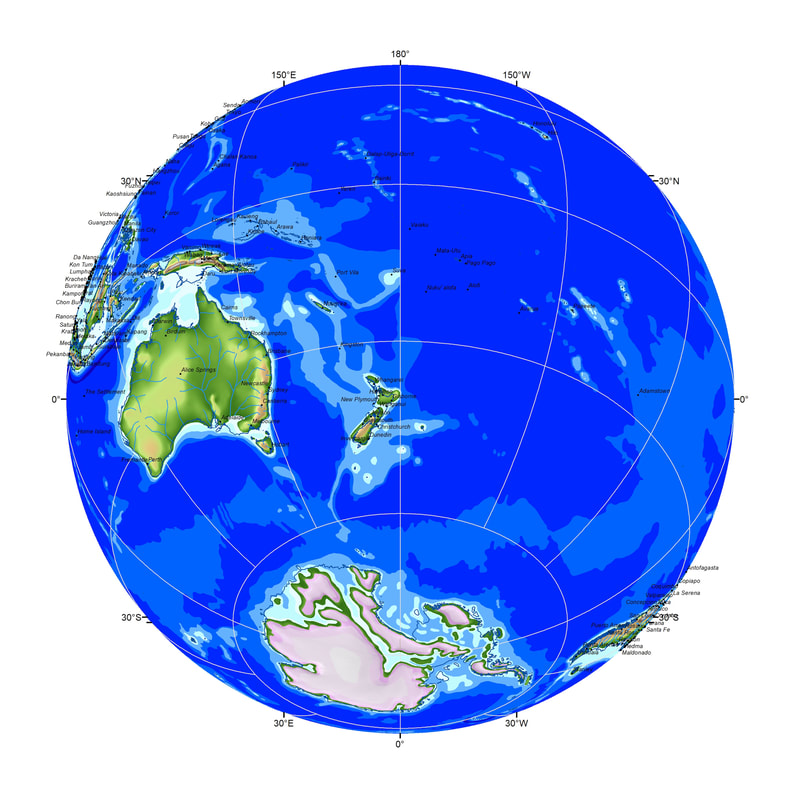
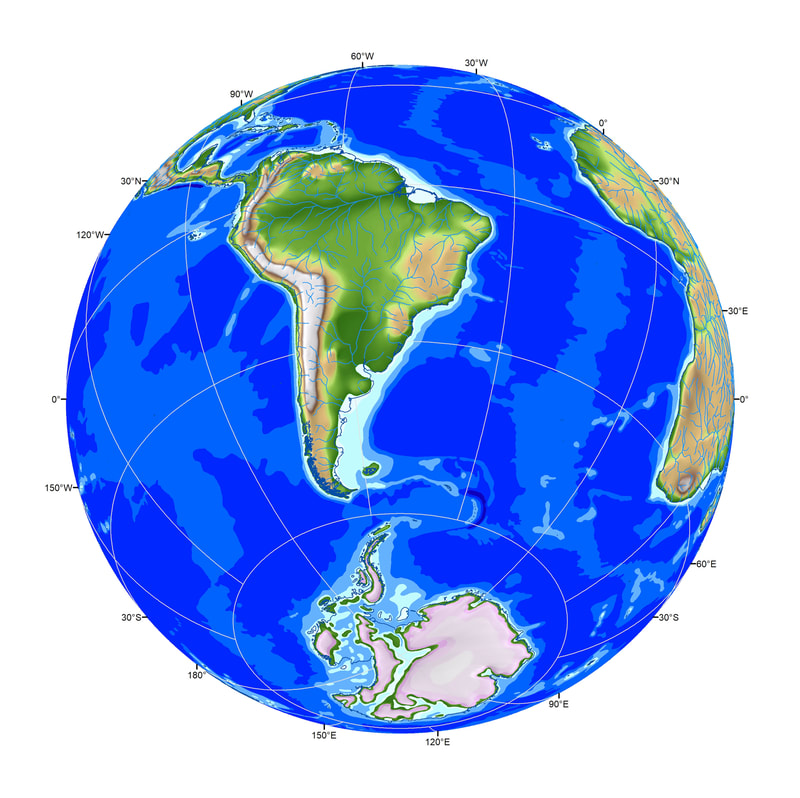
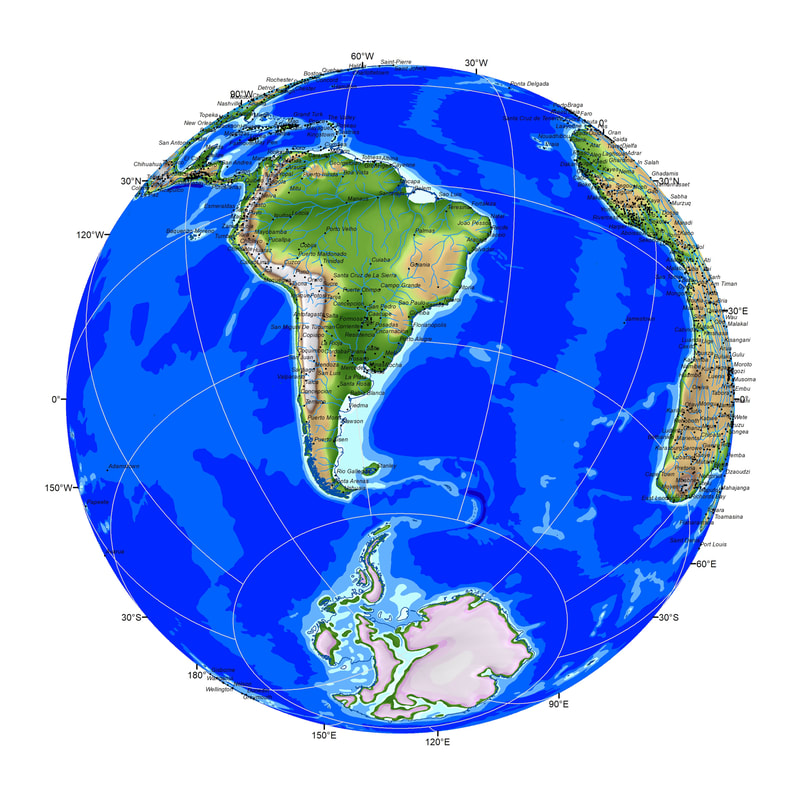
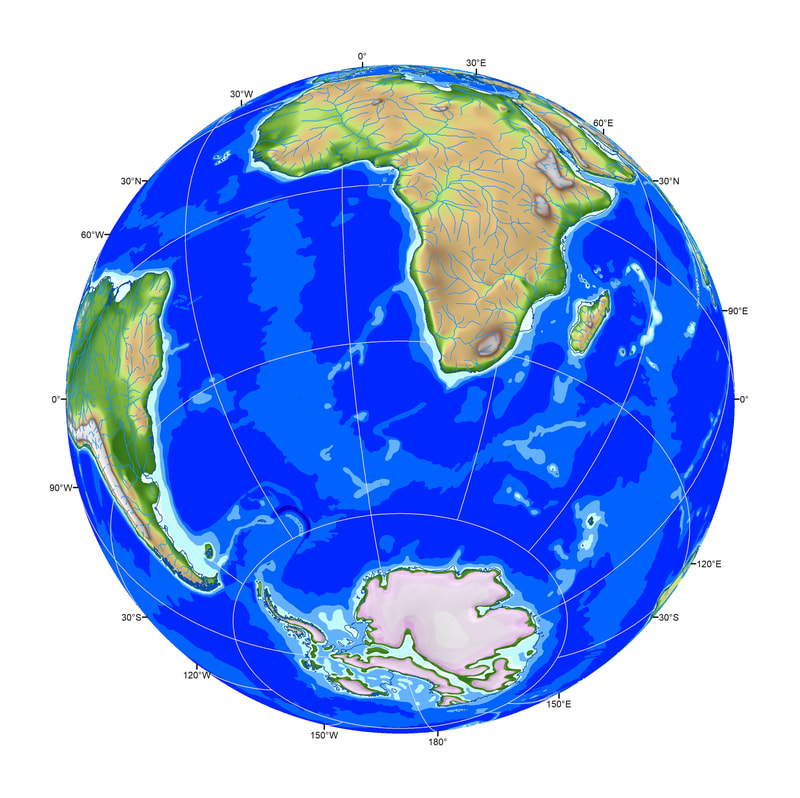
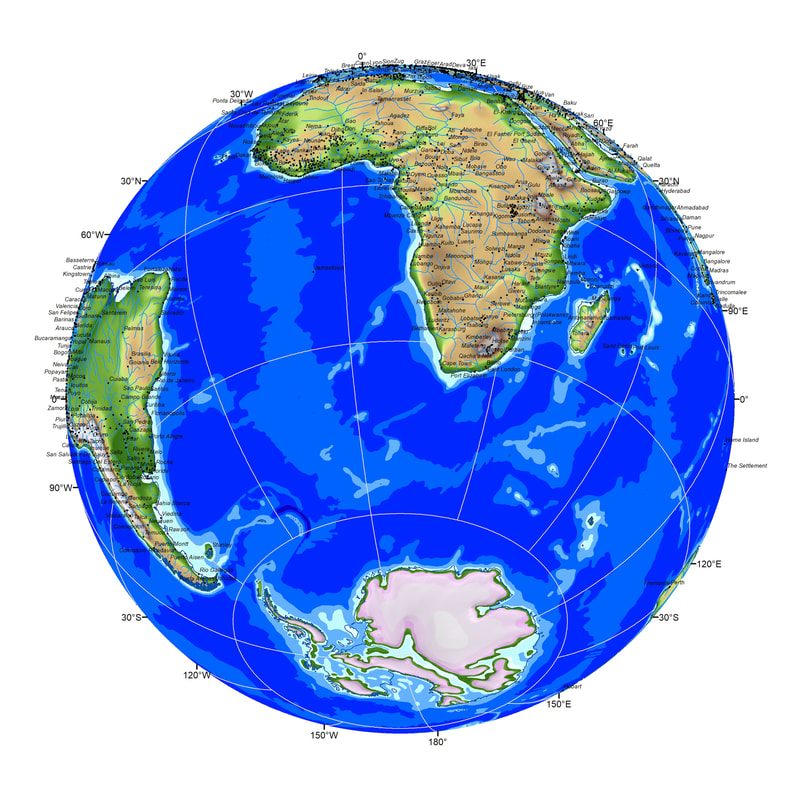
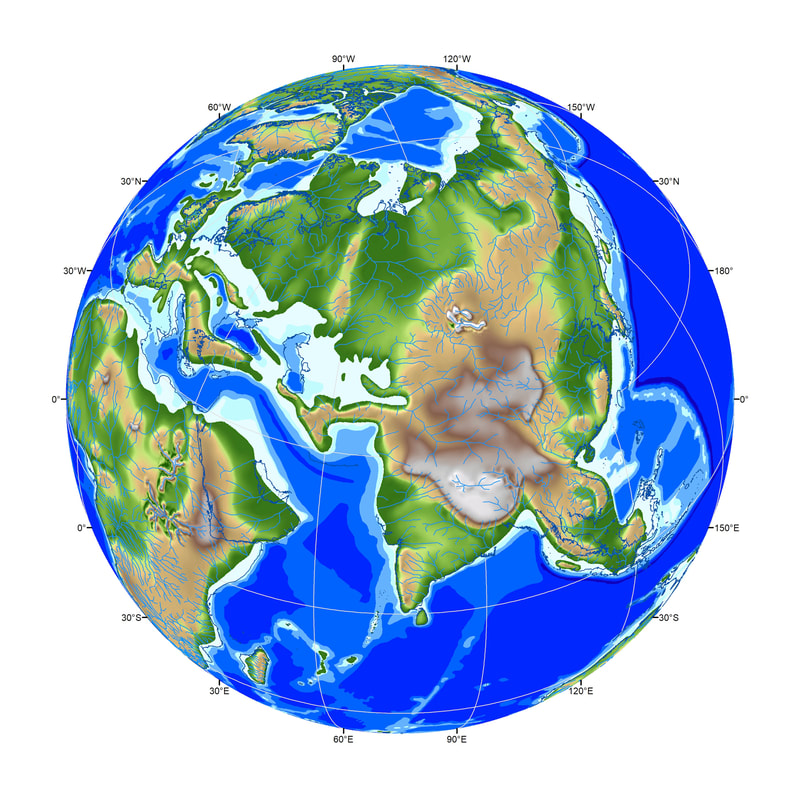
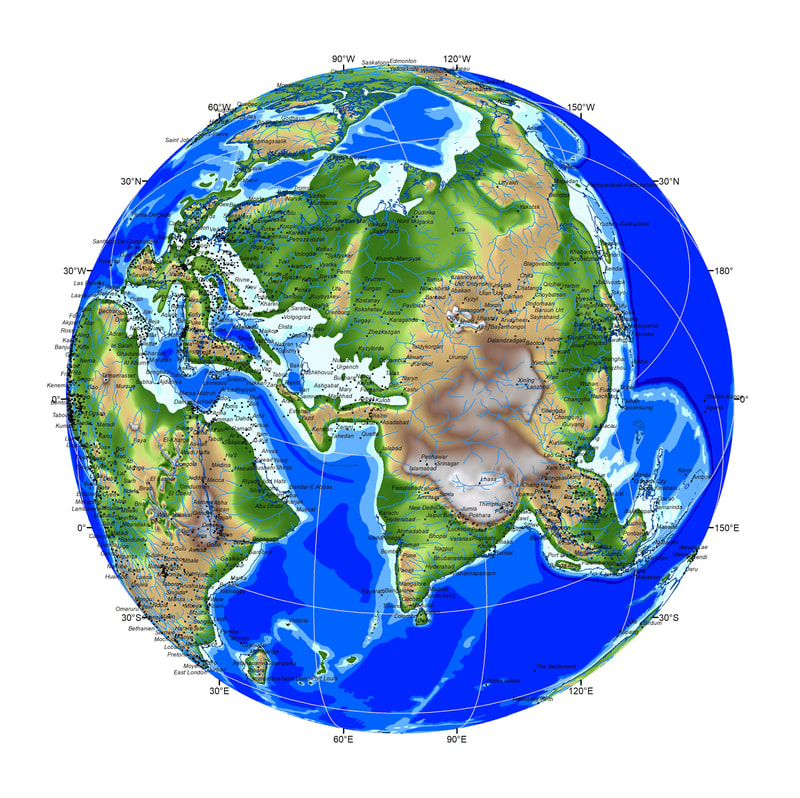
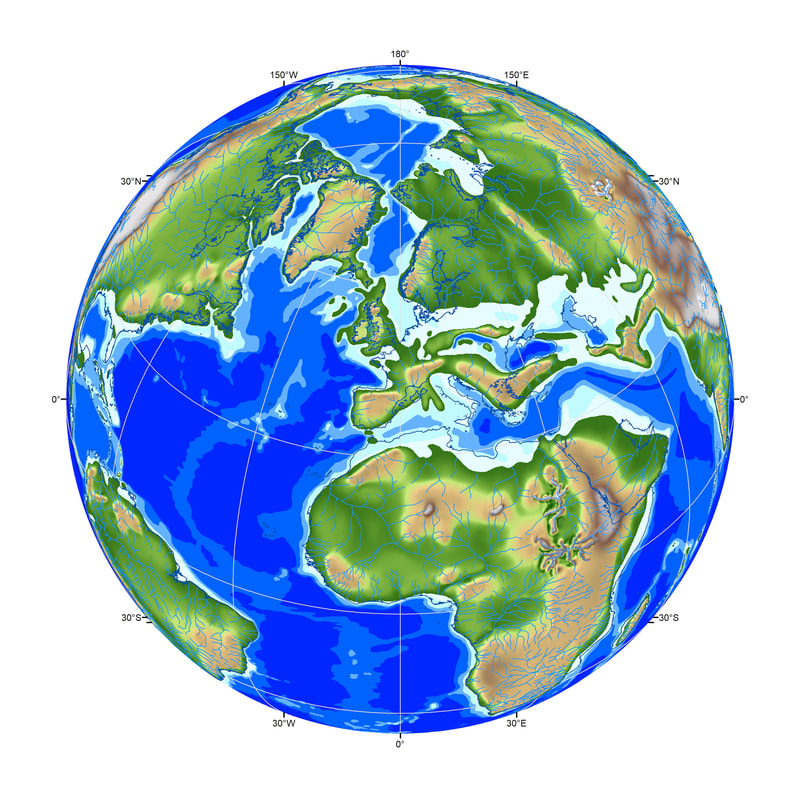
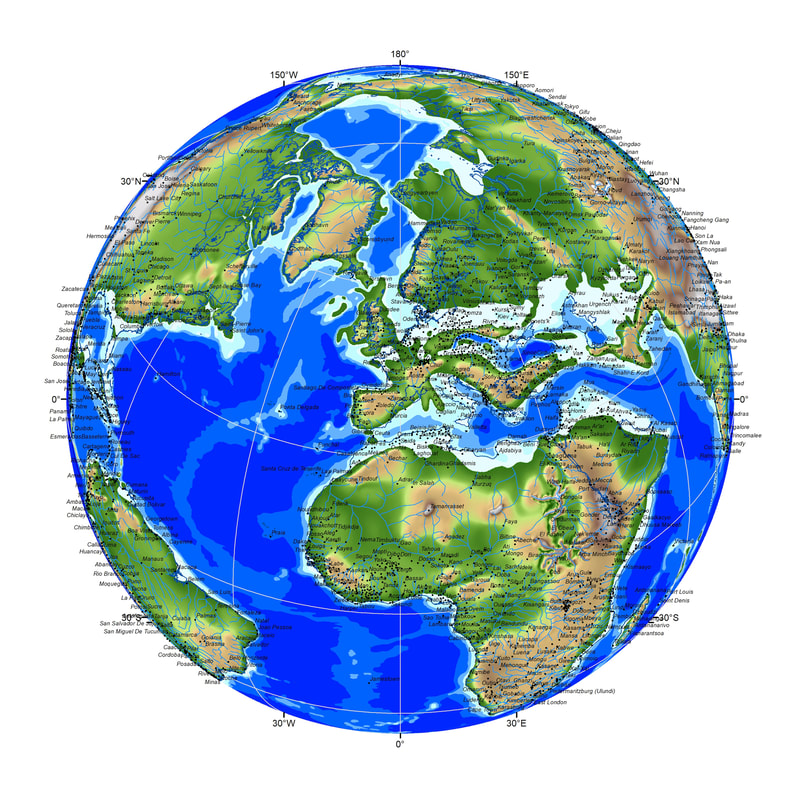
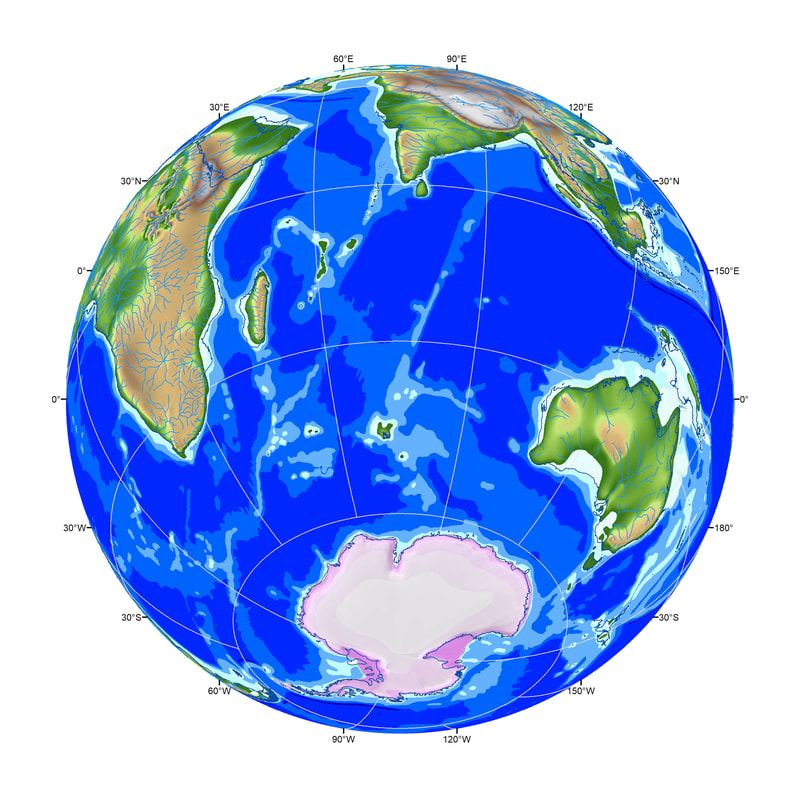
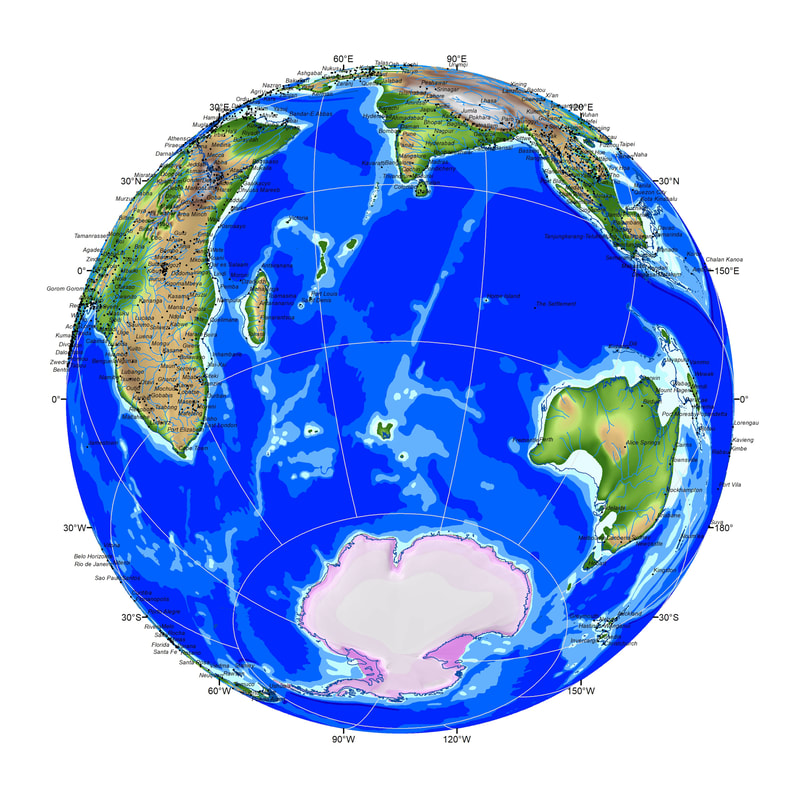
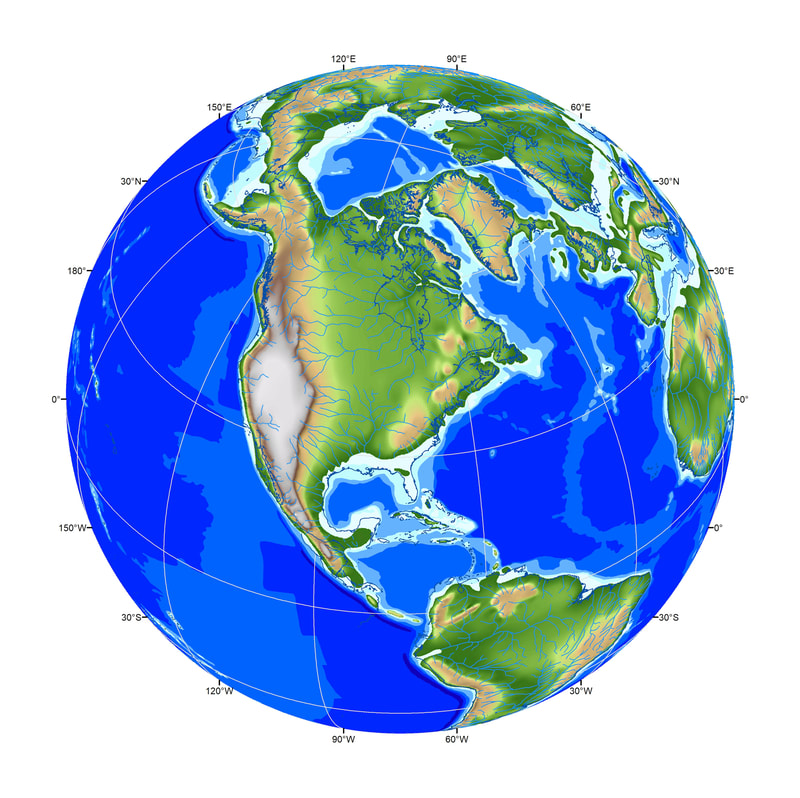
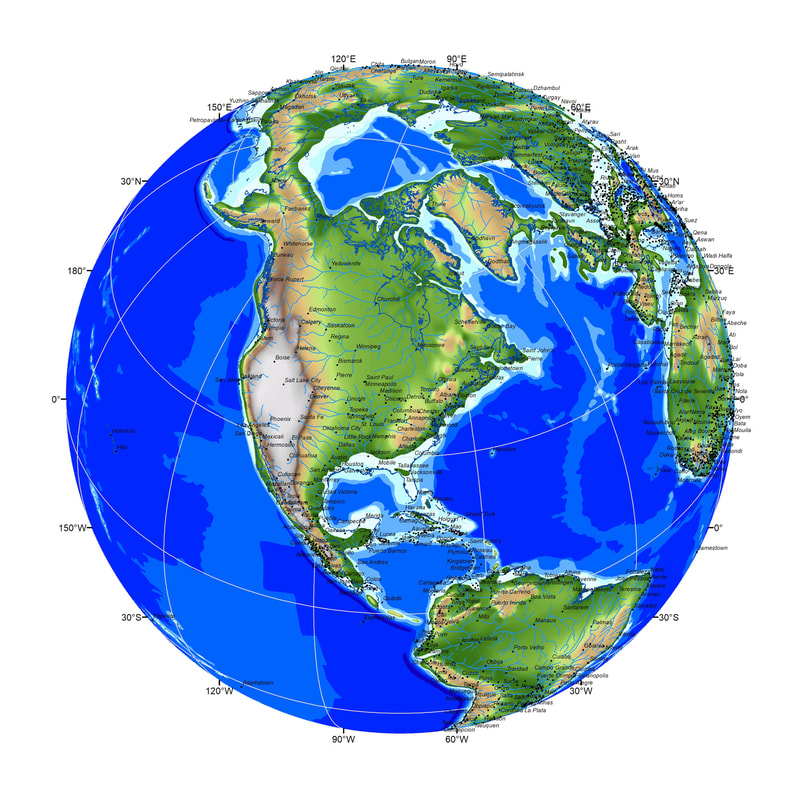
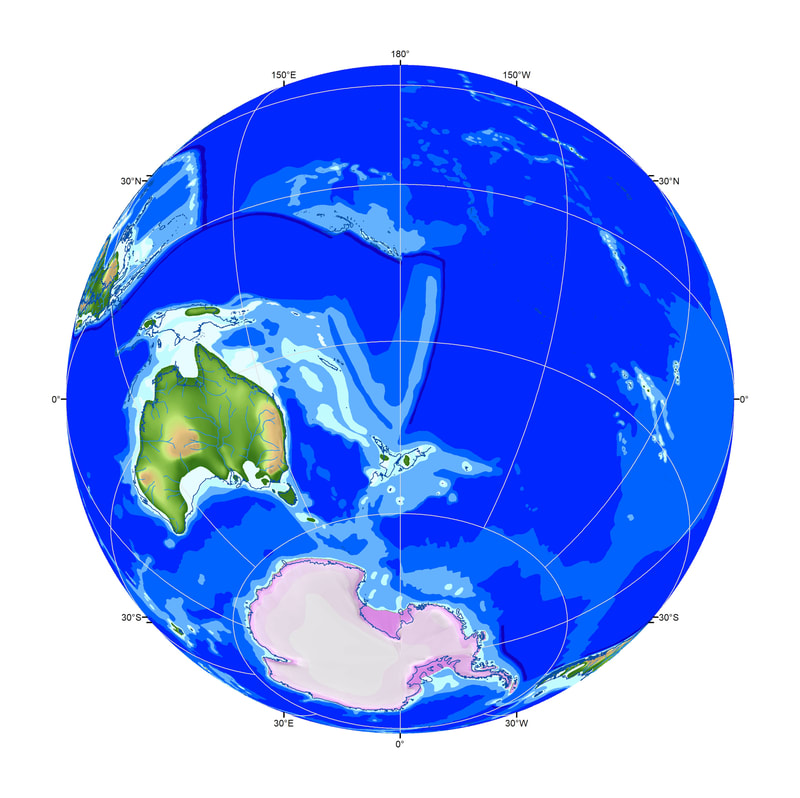
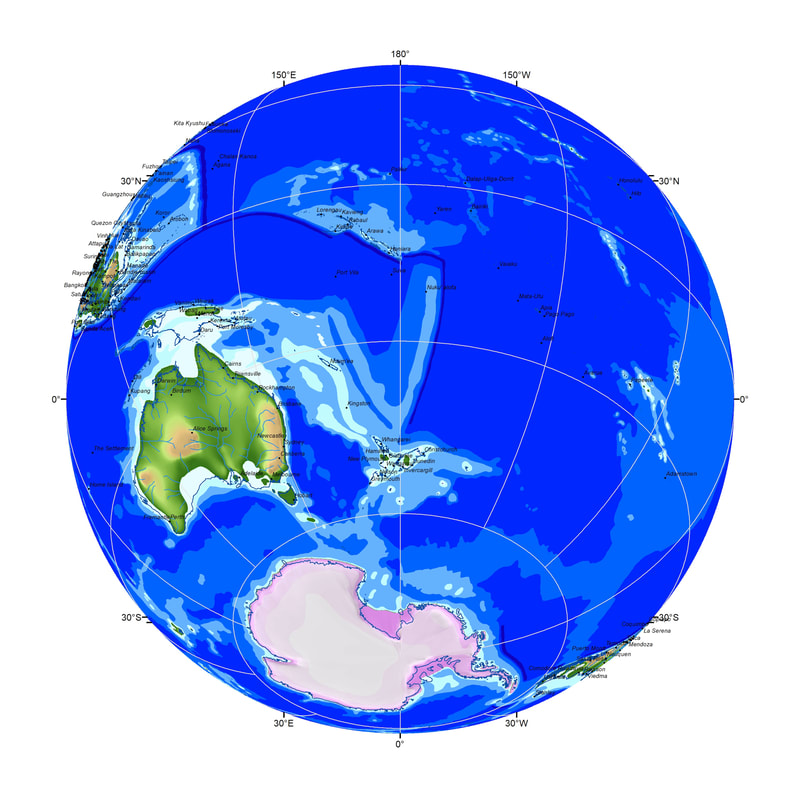
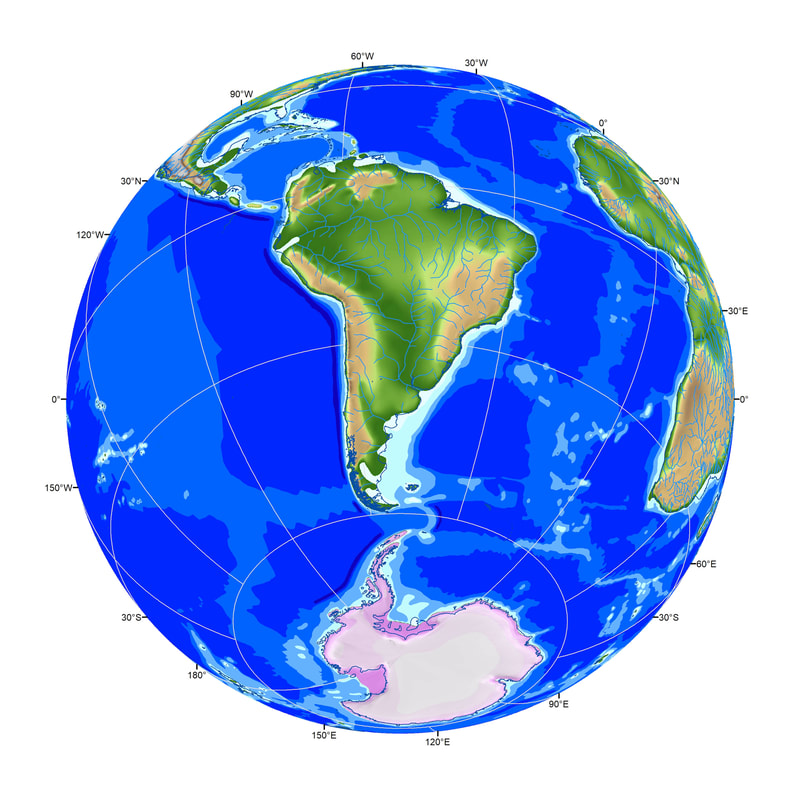
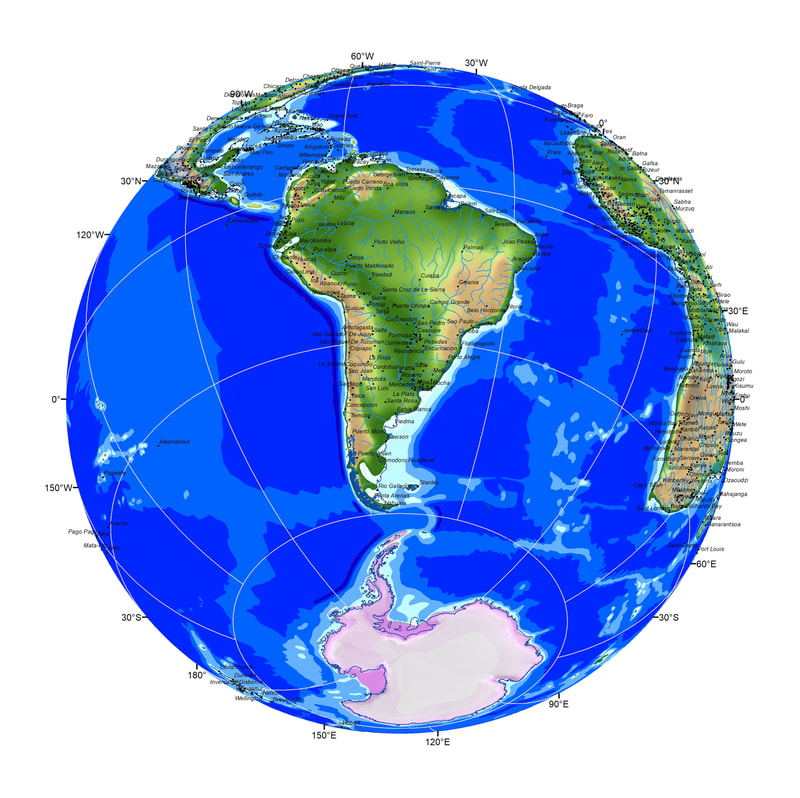
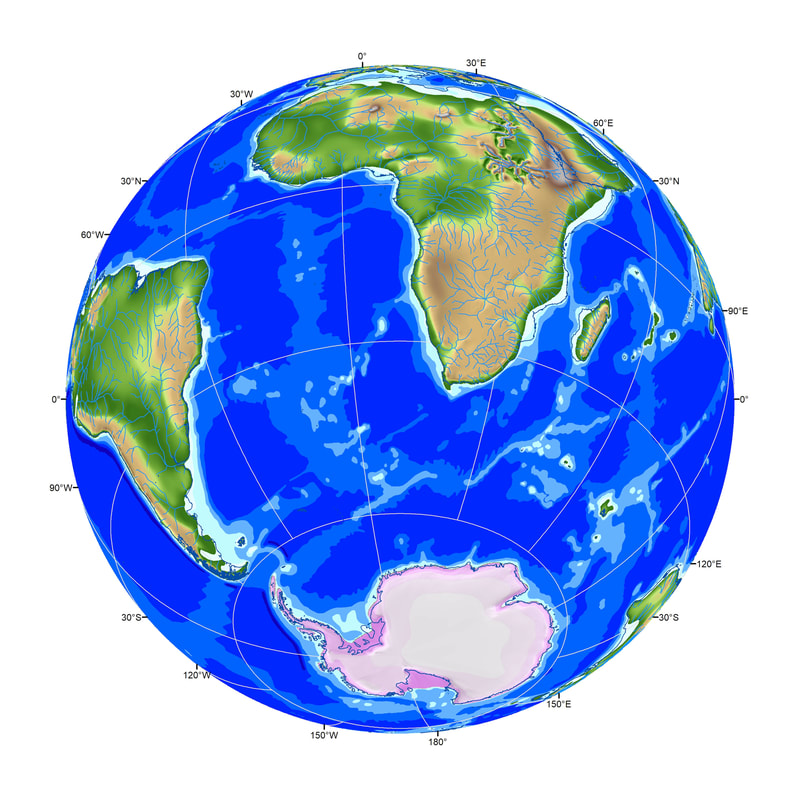
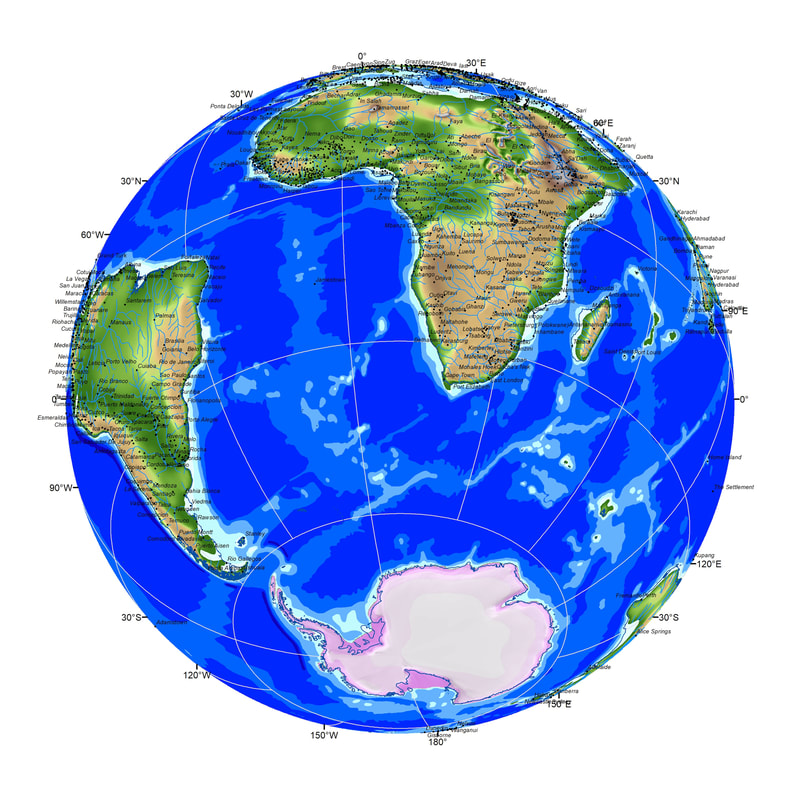
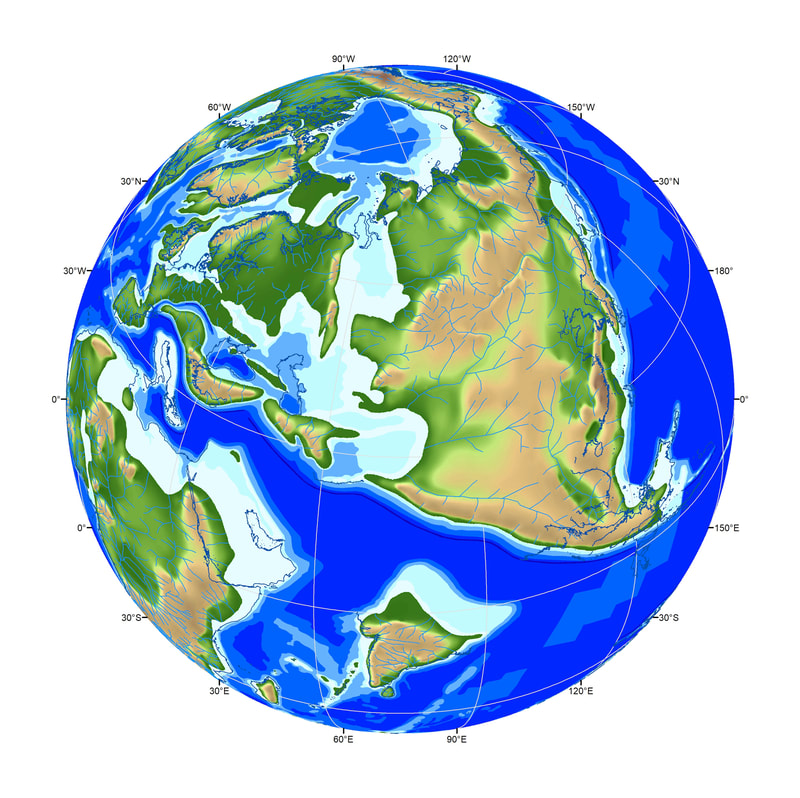
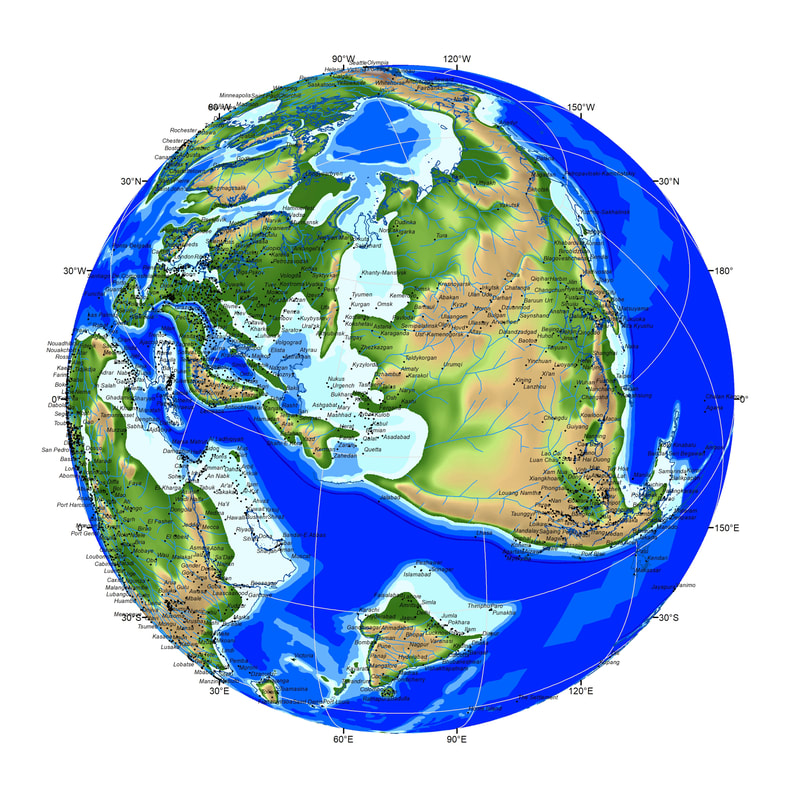
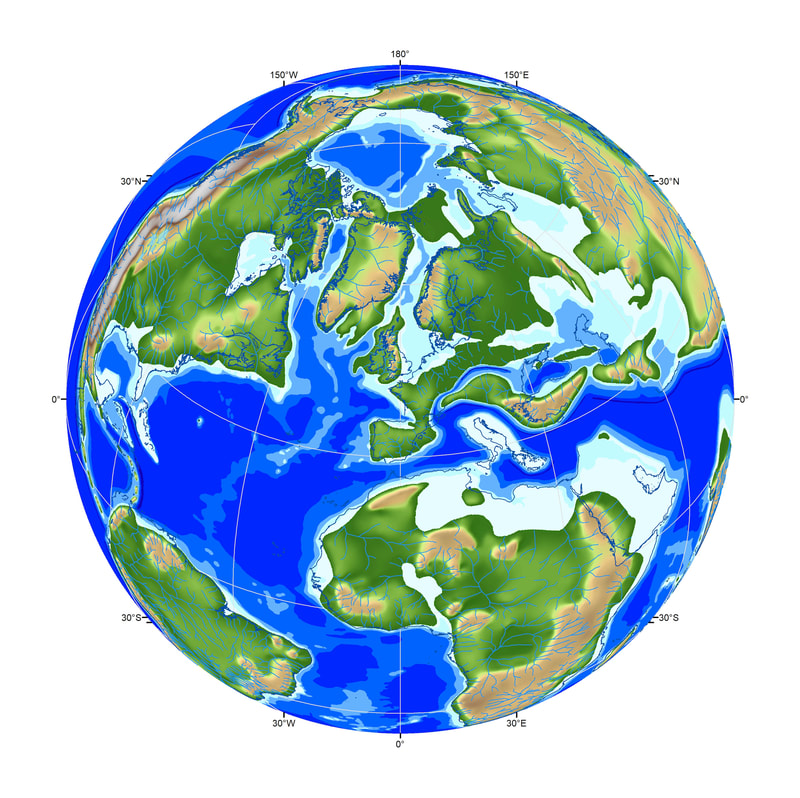
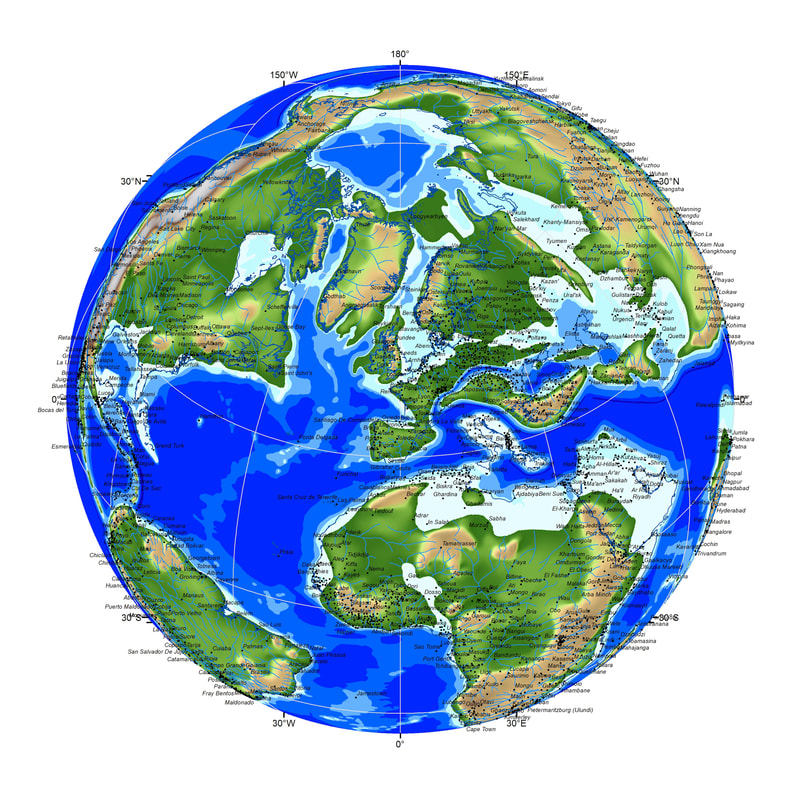
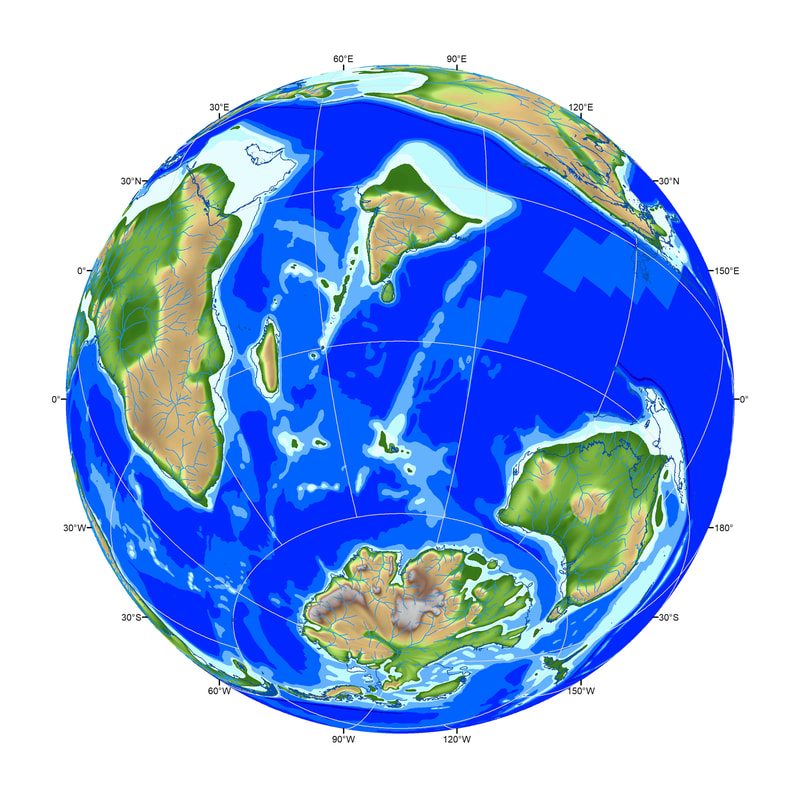
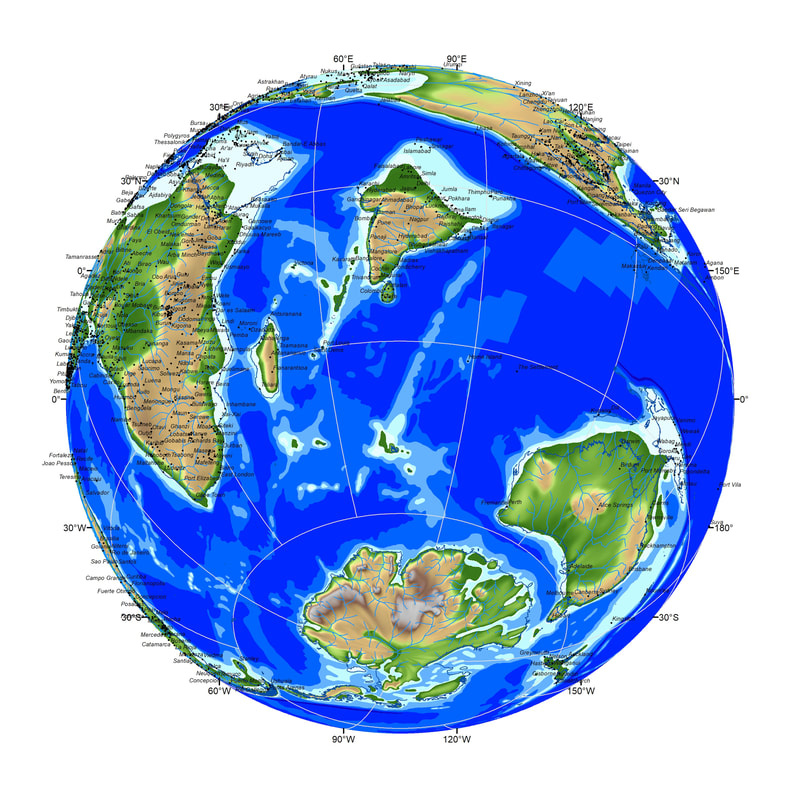
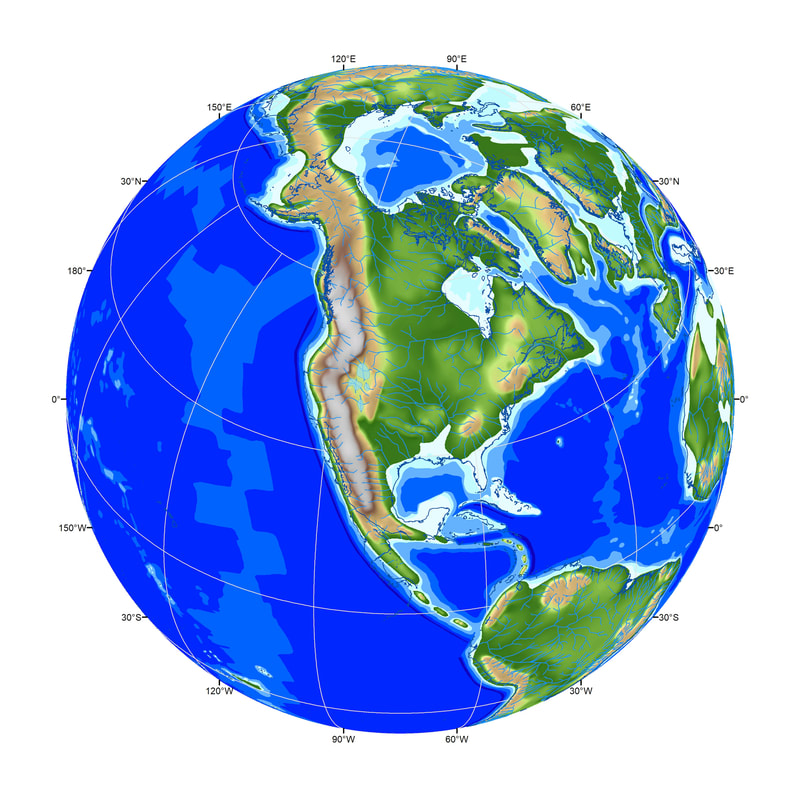
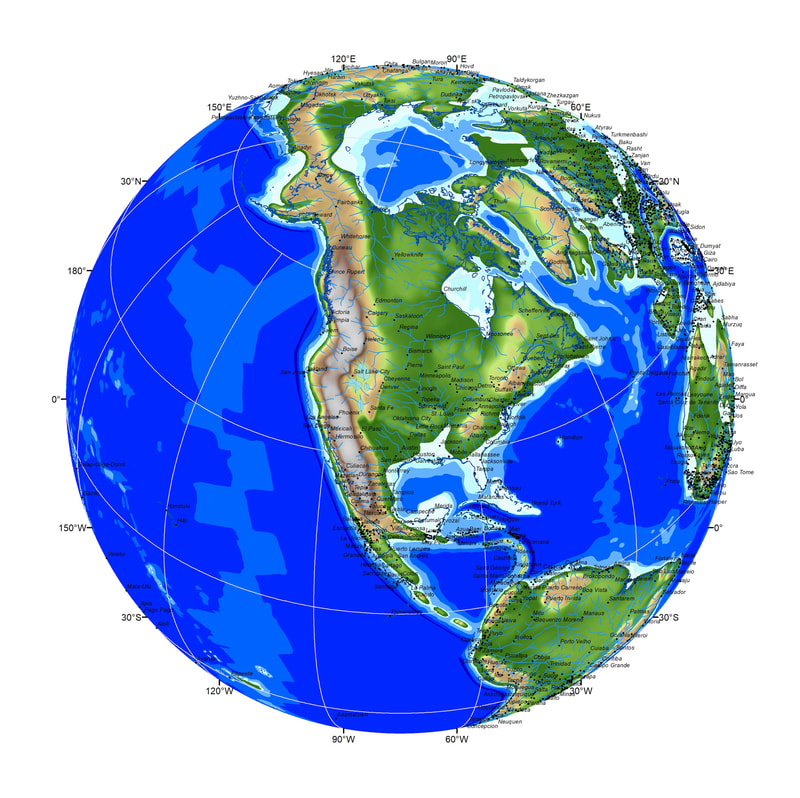
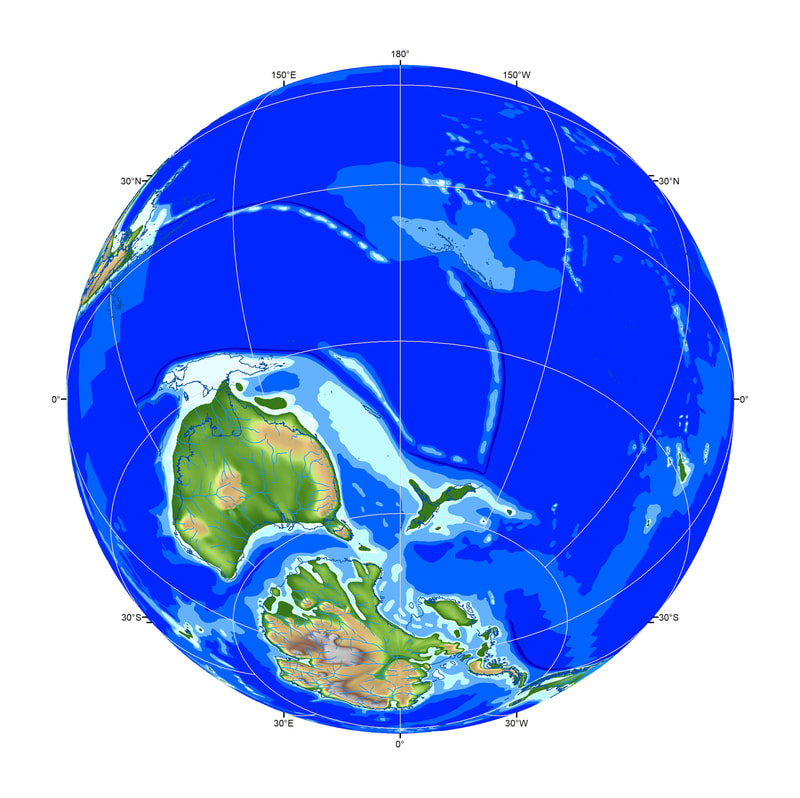
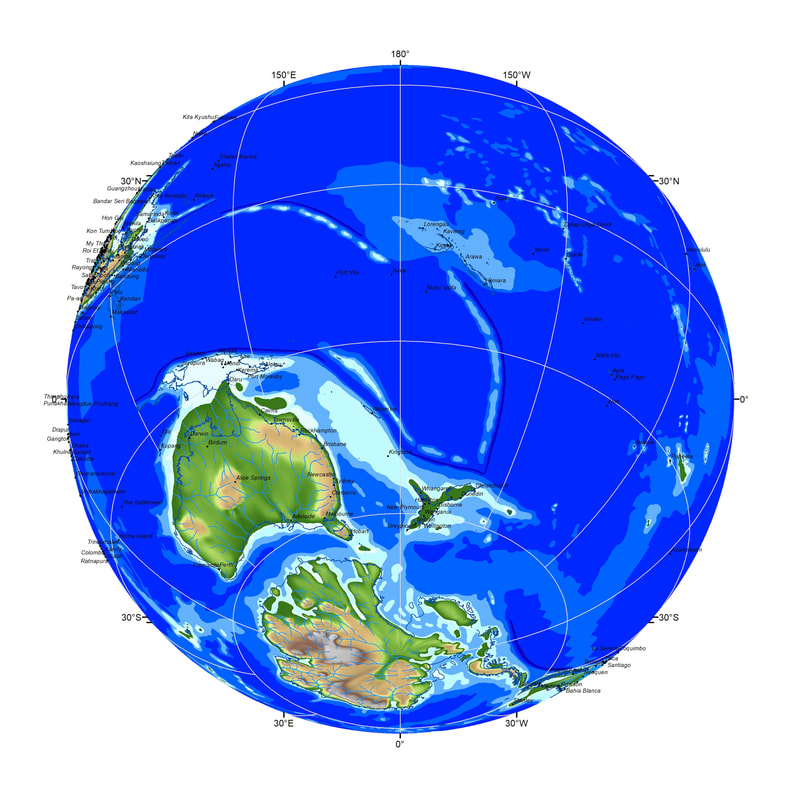
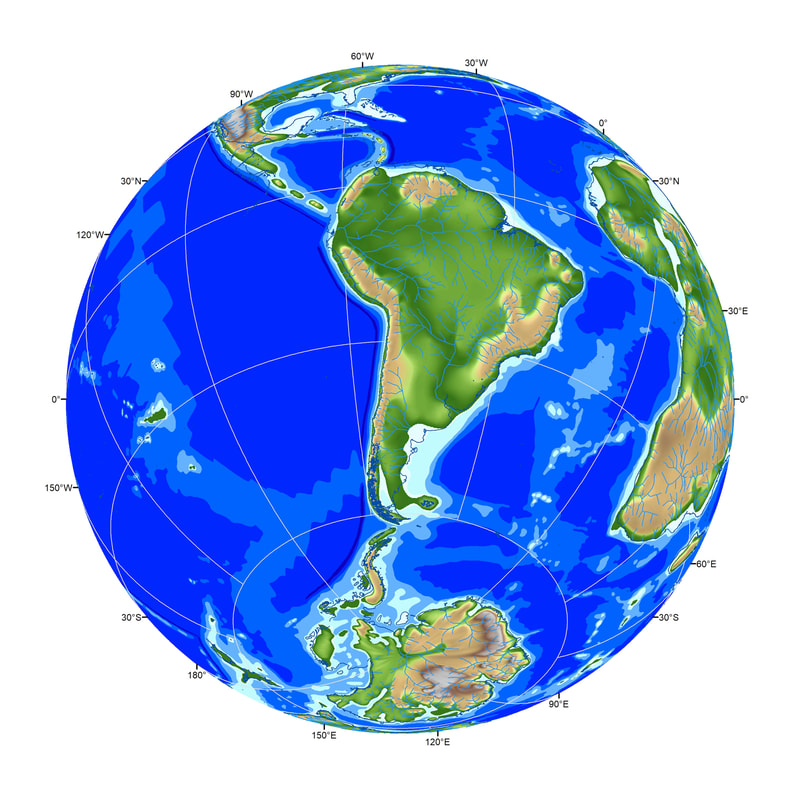
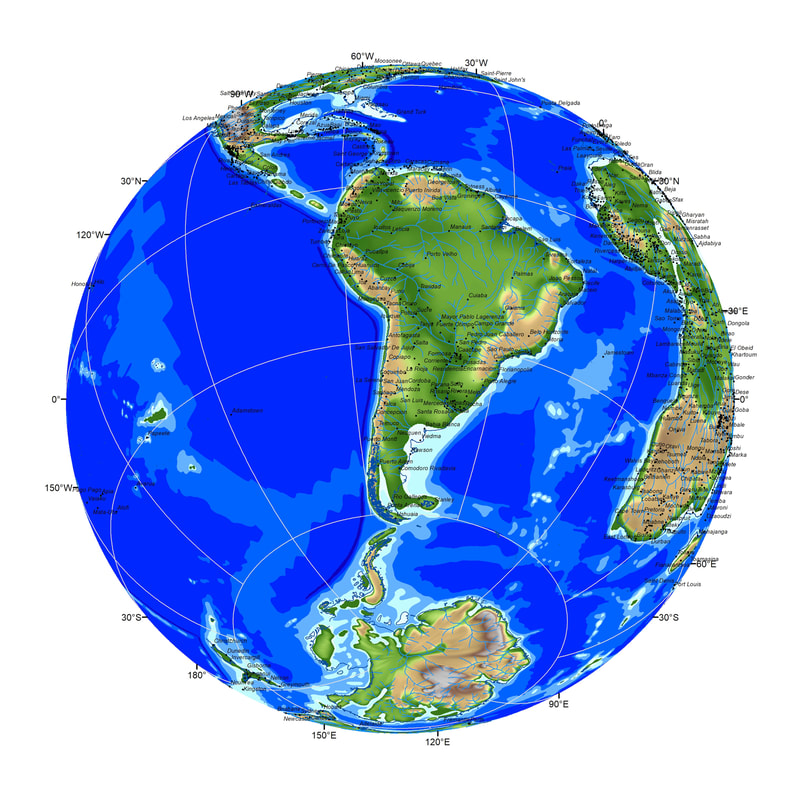
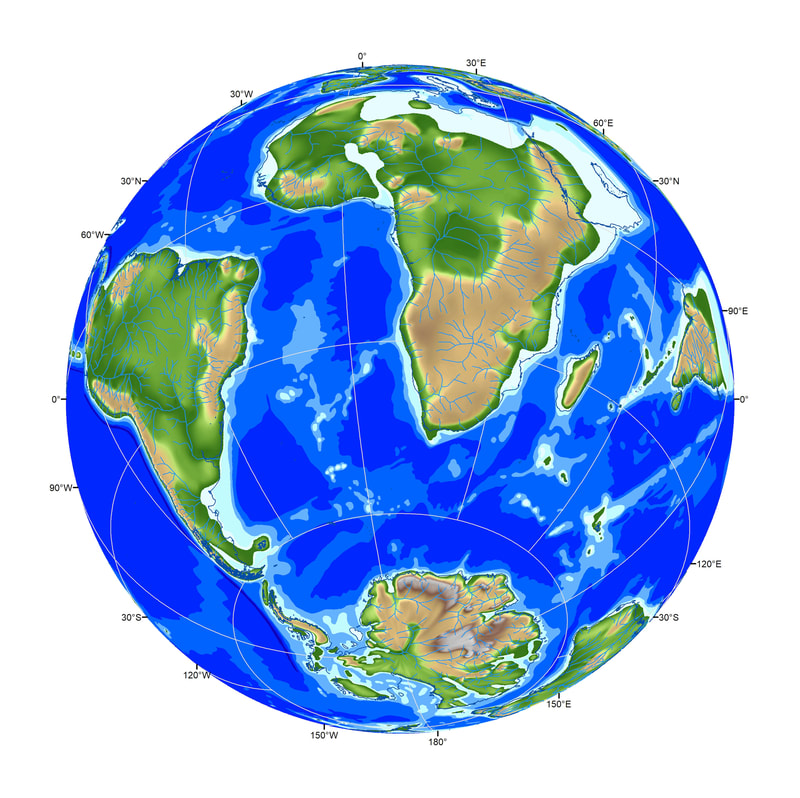
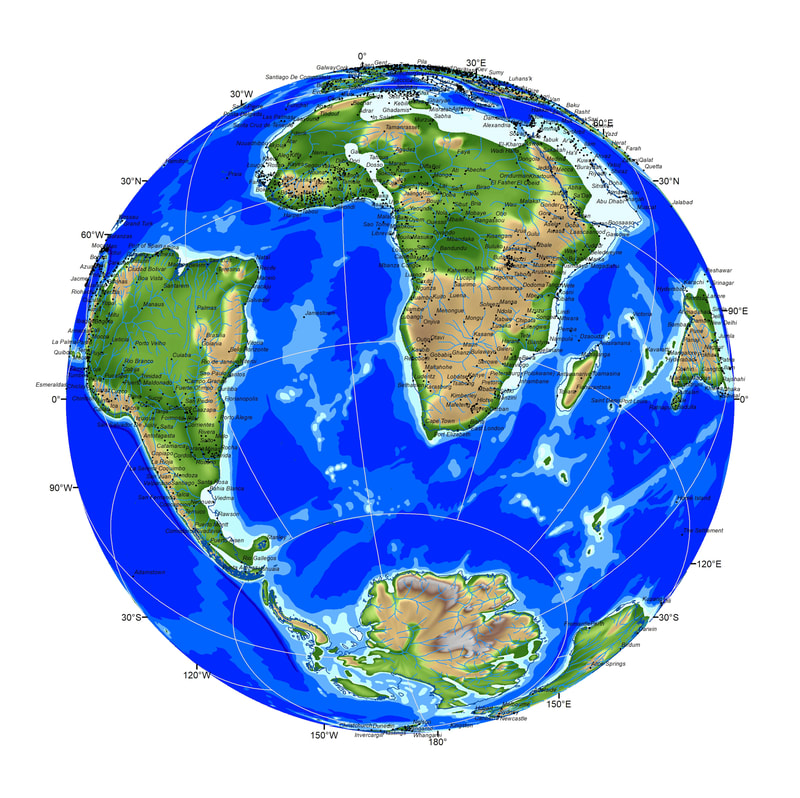
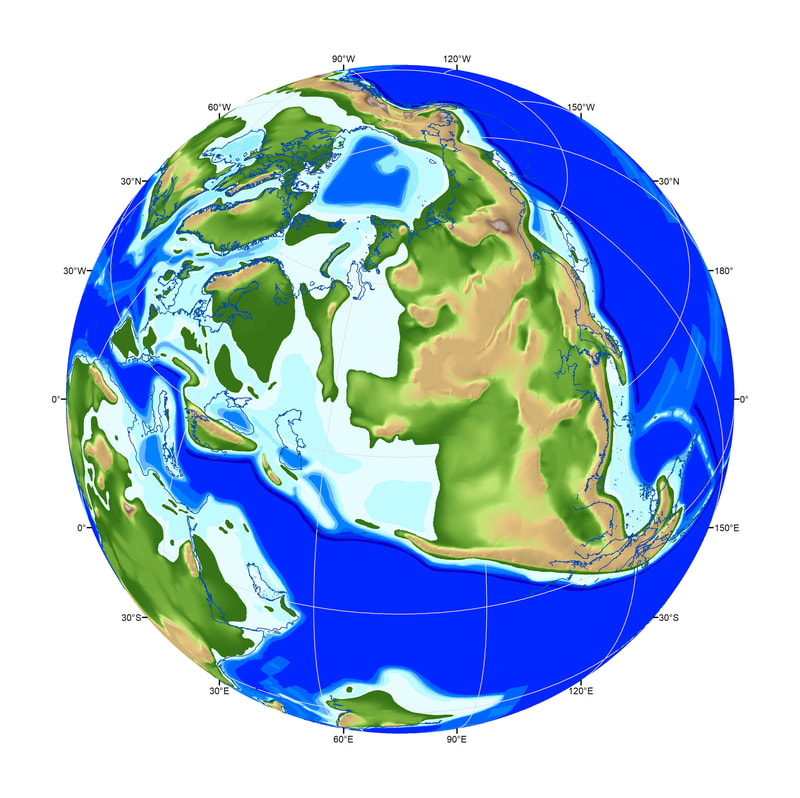
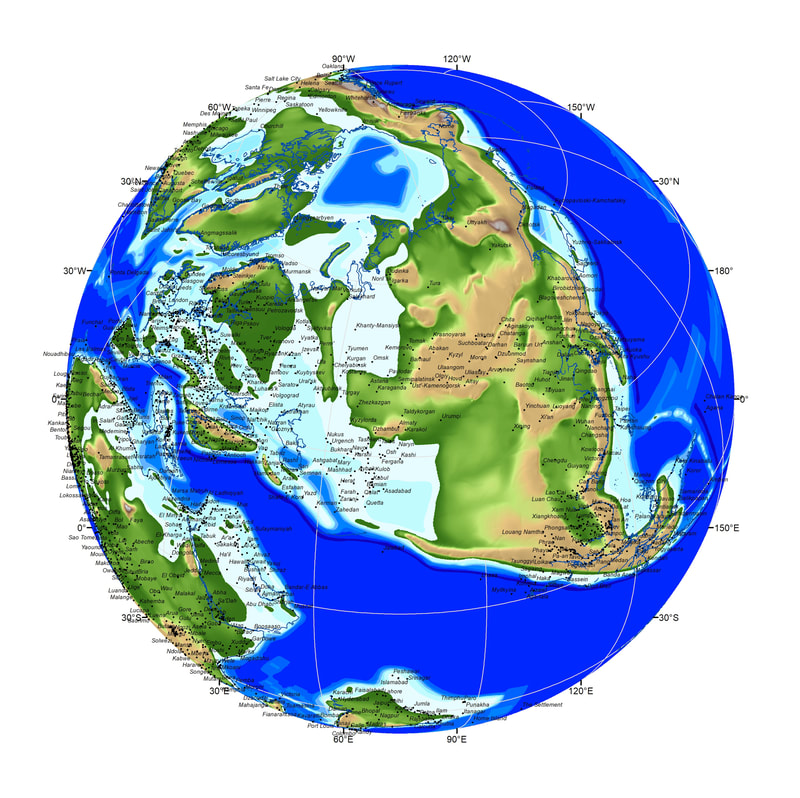
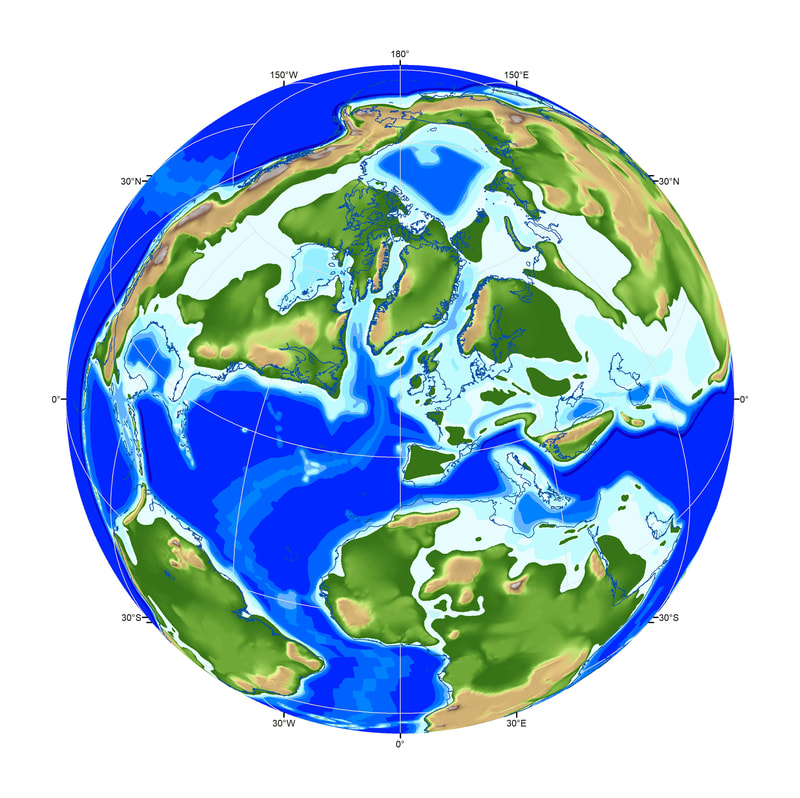
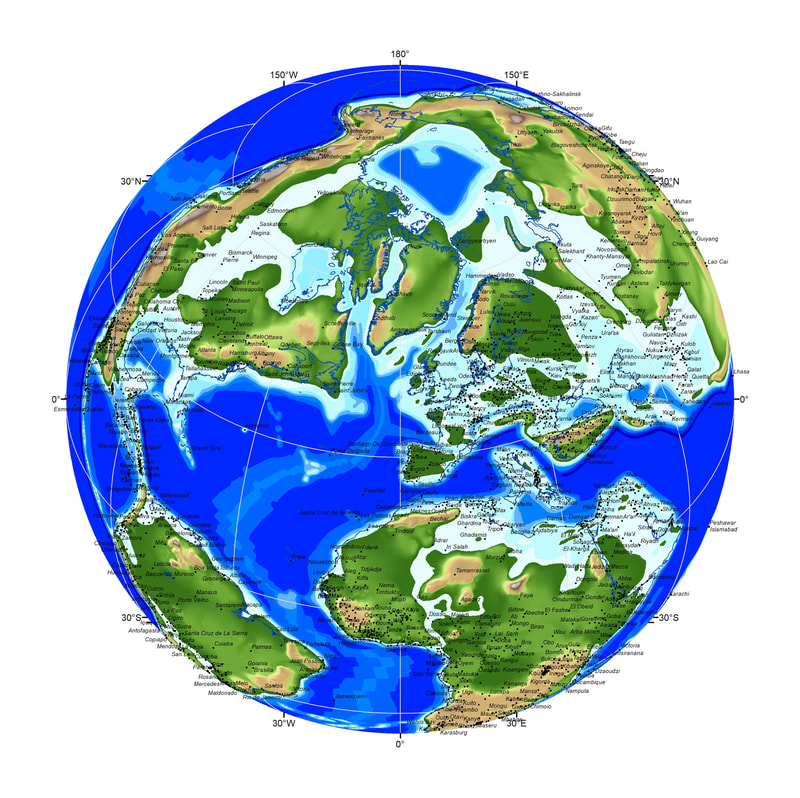
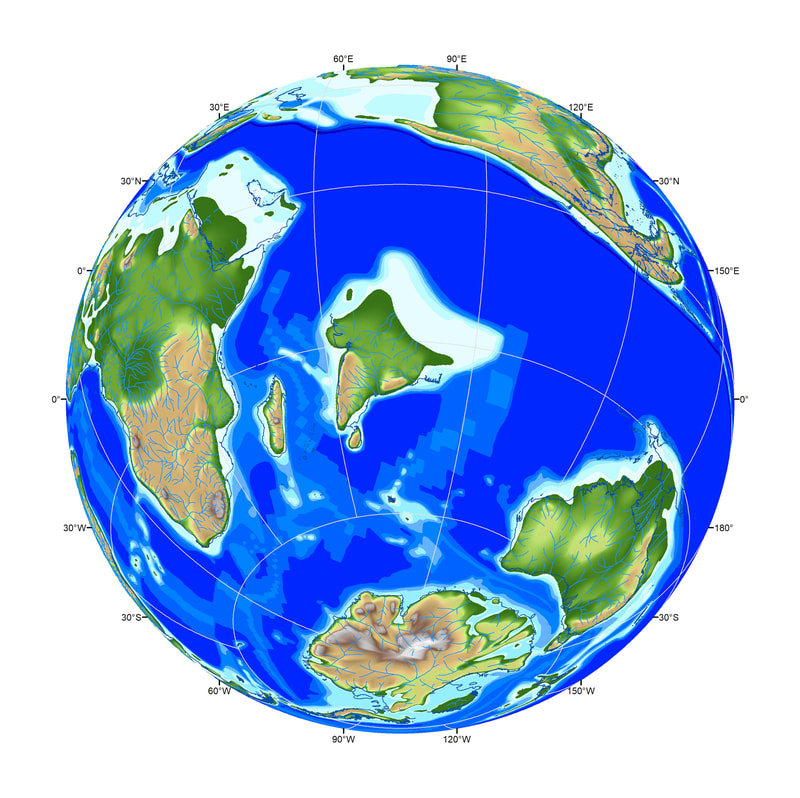
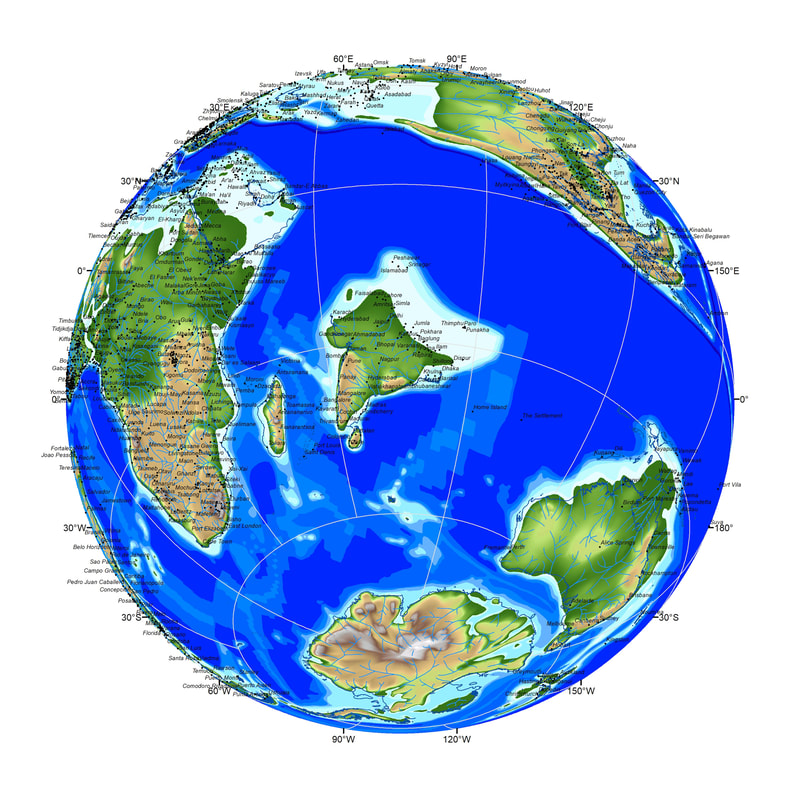
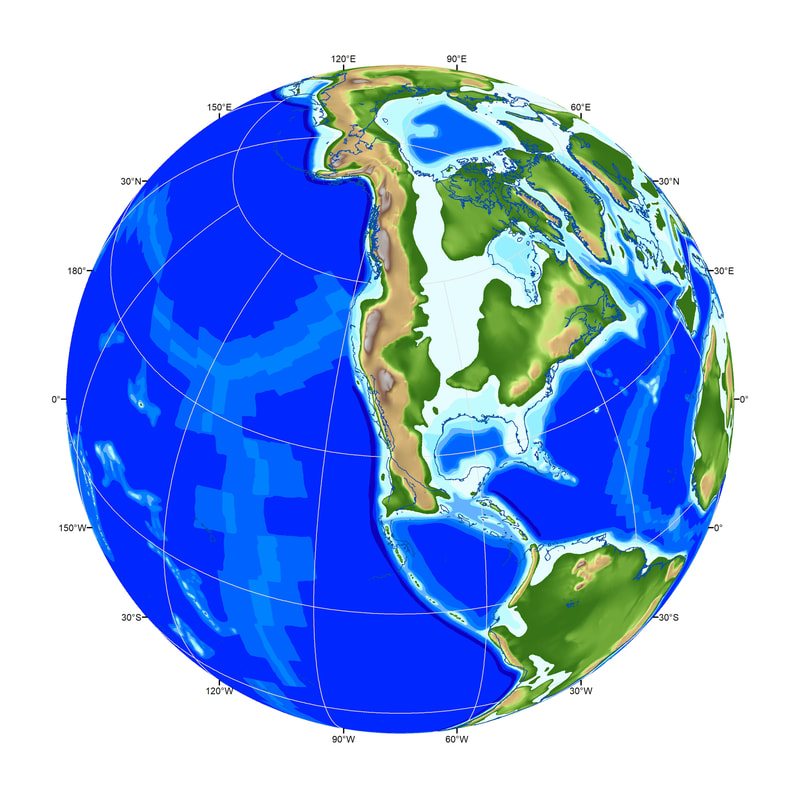
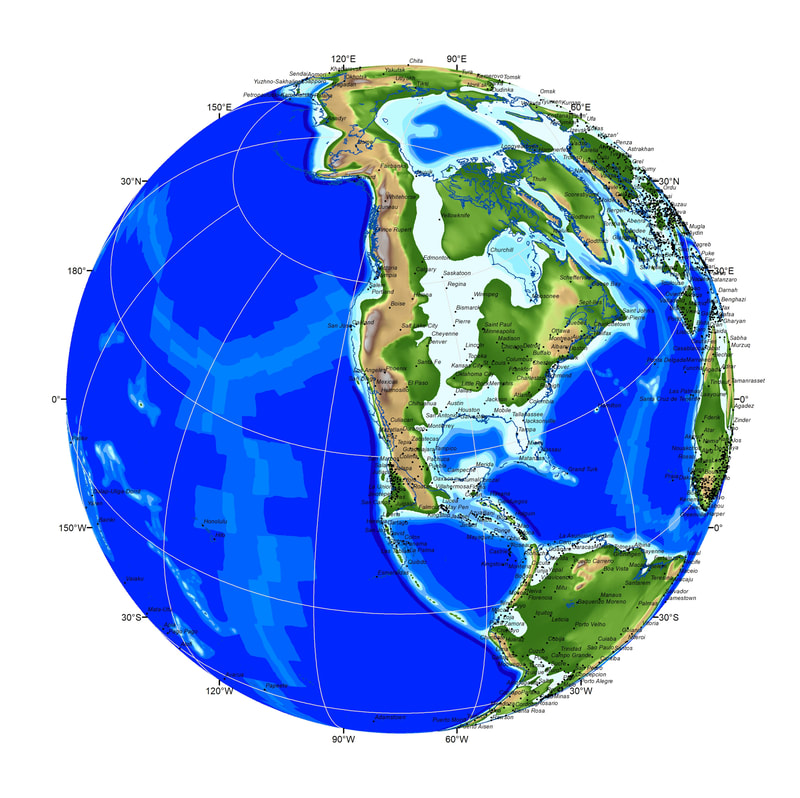
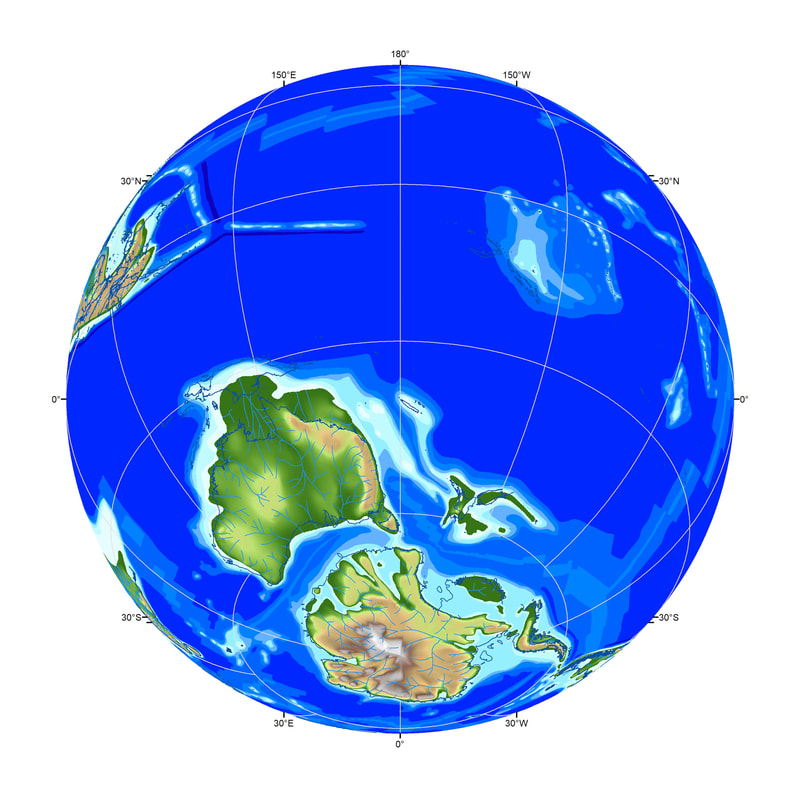
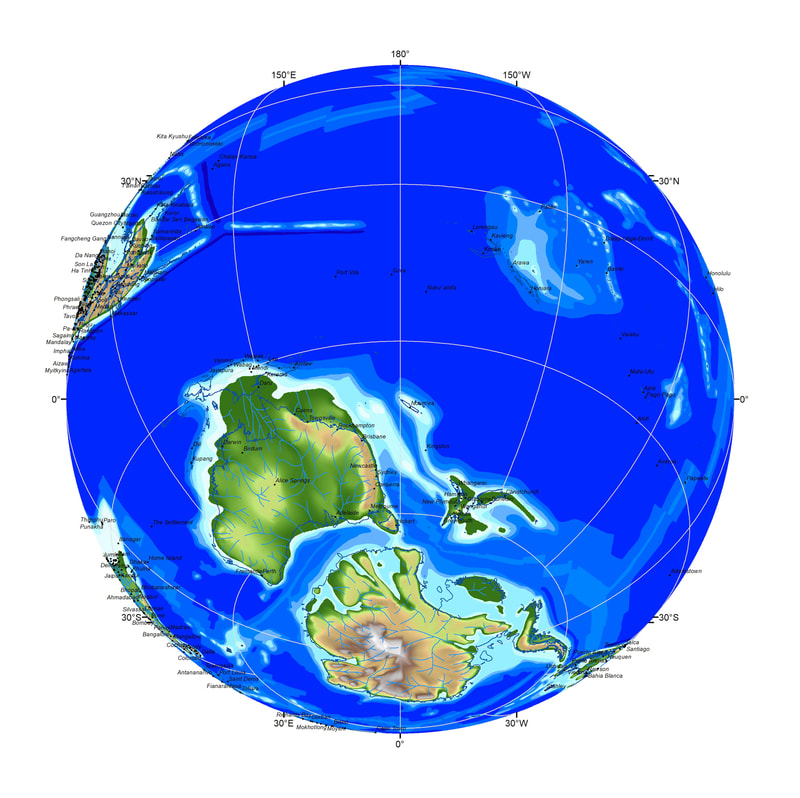
The following globes represent different views of the Maastrichtian (latest Cretaceous), Early Eocene, Late Oligocene and Pliocene worlds. We have generated two versions of each image, one with cities rotated to their paleo-position and one without.
The Maastrichtian work was published in Markwick & Valdes (2004). The other three time slices were worked up for specific academic projects. These maps date back to 2004 and so much has been learned since. So, if you have questions about any of the features mapped please do contact Paul at [email protected] you will be able to provide the latest ideas and what we are working on at present.
If you use any of these please site either my 2004 paper or this website: Markwick, P. J., and Valdes, P. J., 2004, Palaeo-digital elevation models for use as boundary conditions in coupled ocean-atmosphere GCM experiments: a Maastrichtian (late Cretaceous) example: Palaeogeography, Palaeoclimatology, Palaeoecology, v. 213, p. 37-63.
If you would like to use them for commercial purposes please contact us directly at [email protected]
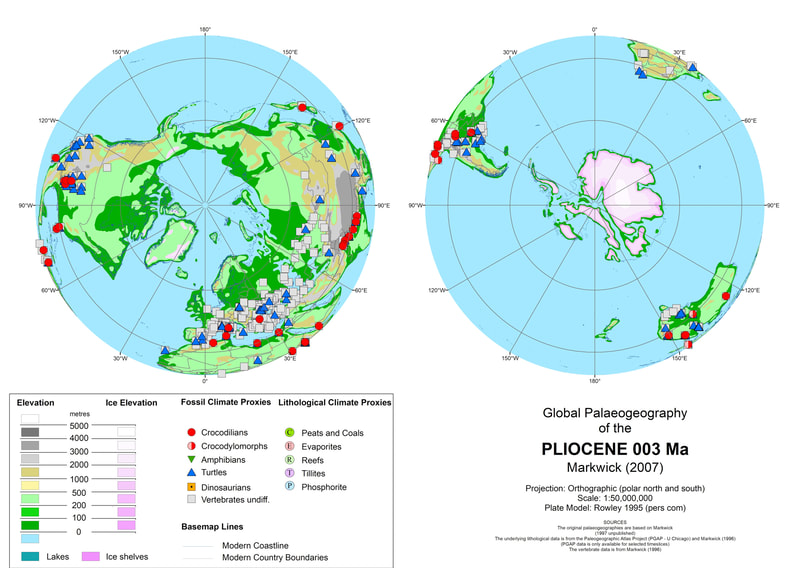
Pliocene (3 Ma)
Chattian, Late Oligocene (26 Ma)
Ypresian, Early Eocene (55 Ma)
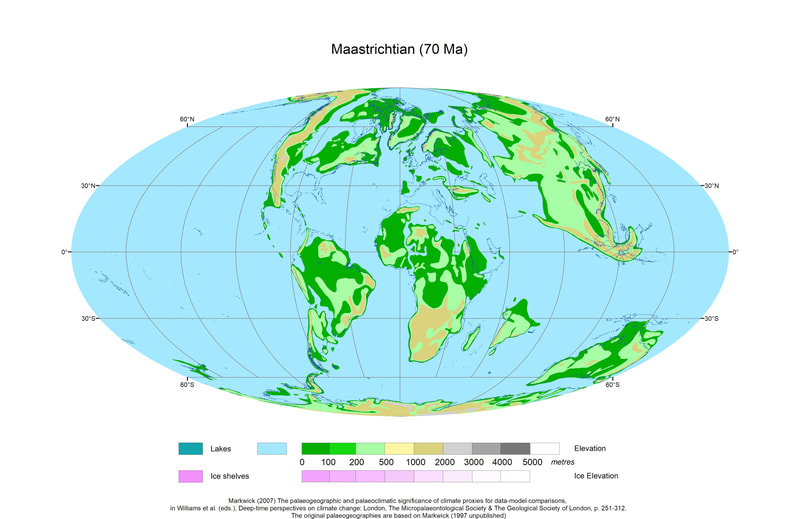
Maastrichtian, Late Cretaceous (70 Ma)
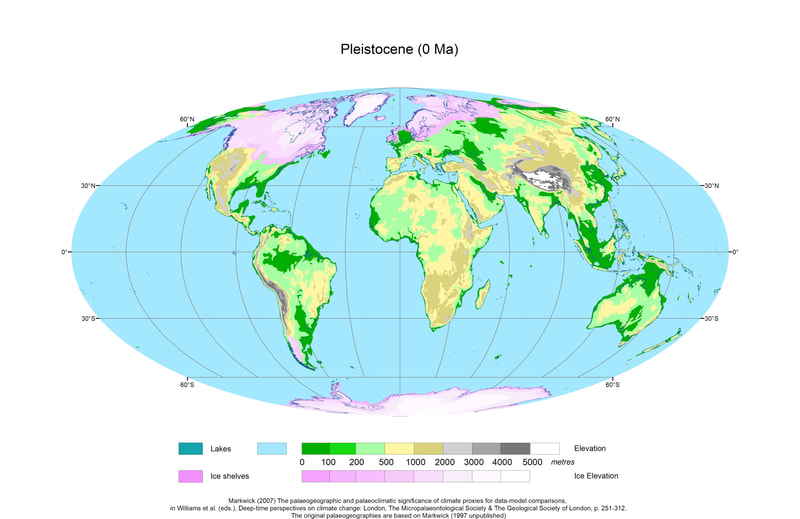
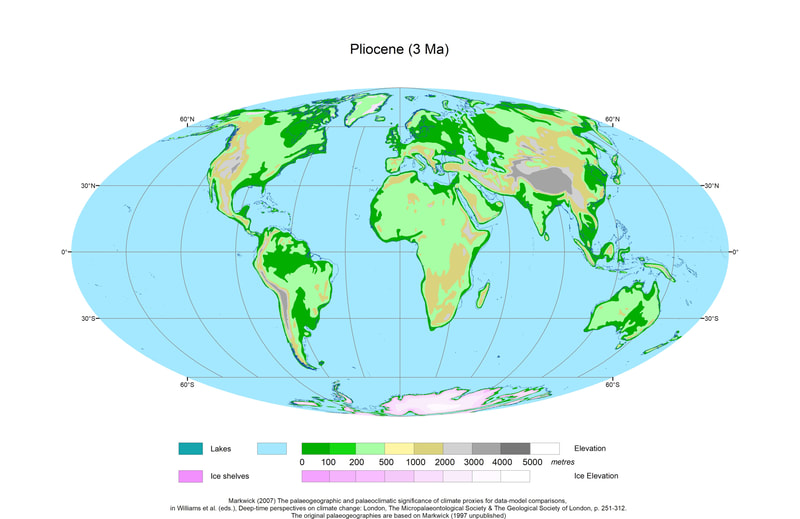
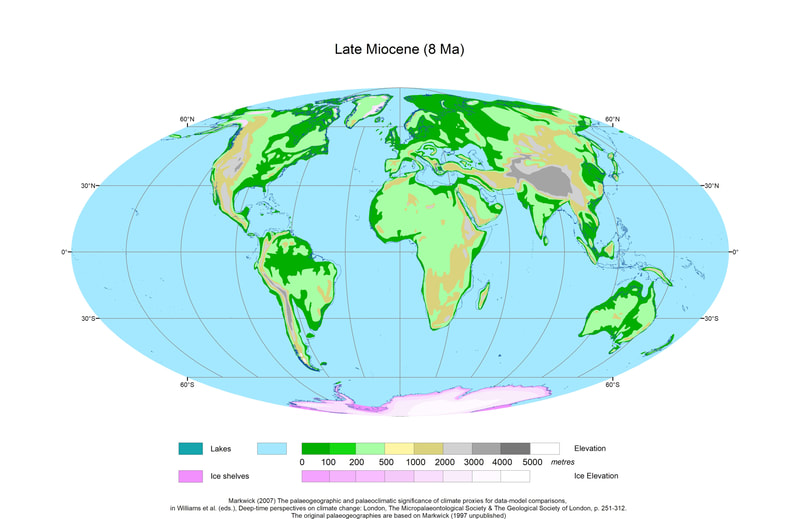
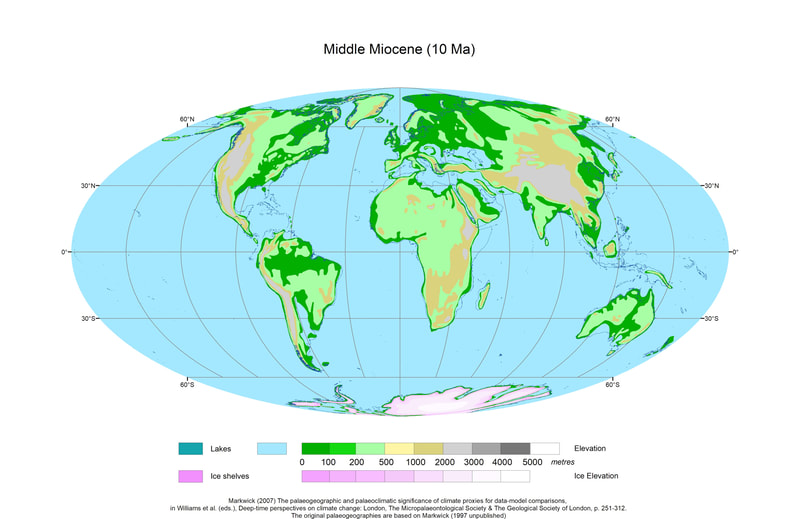
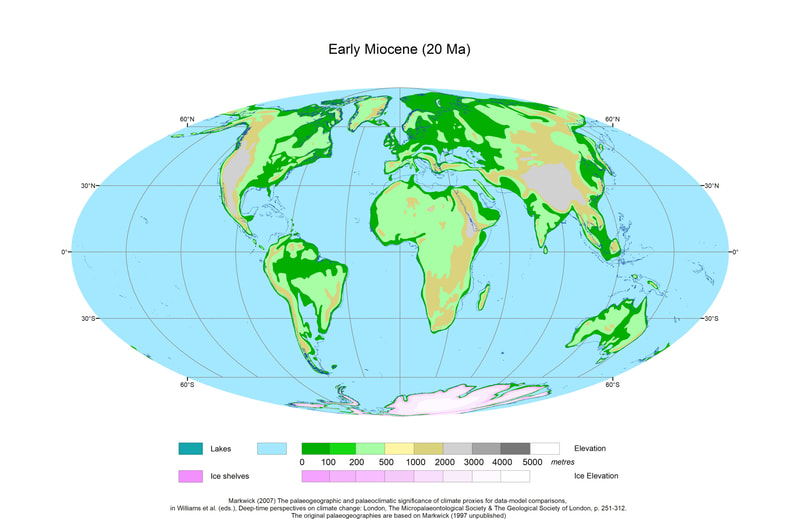
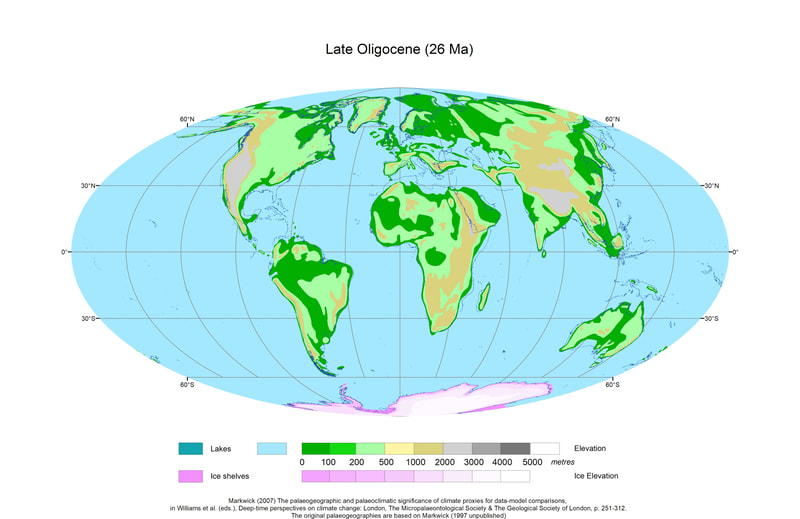
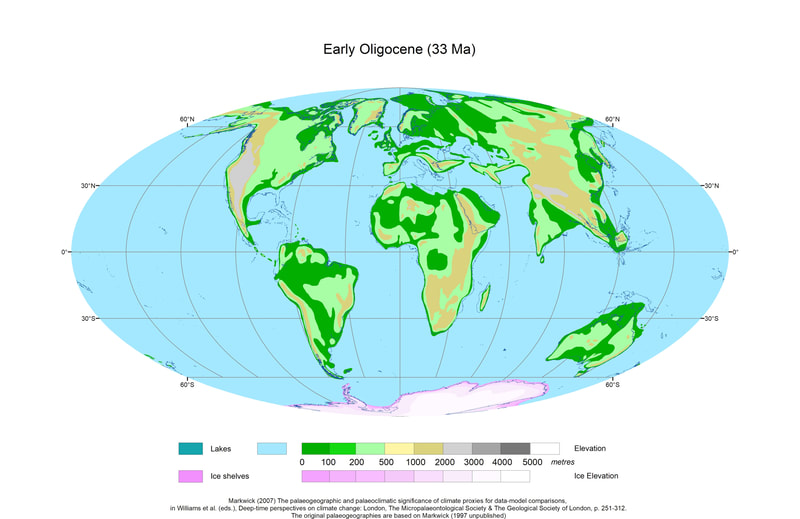
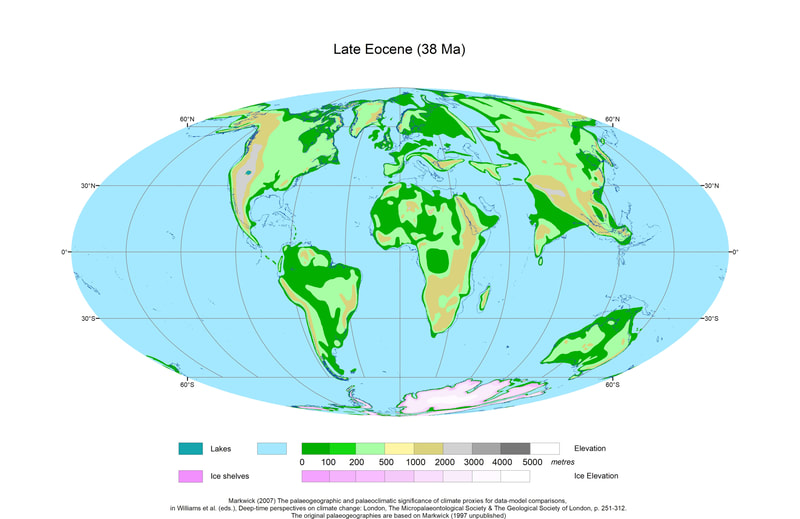
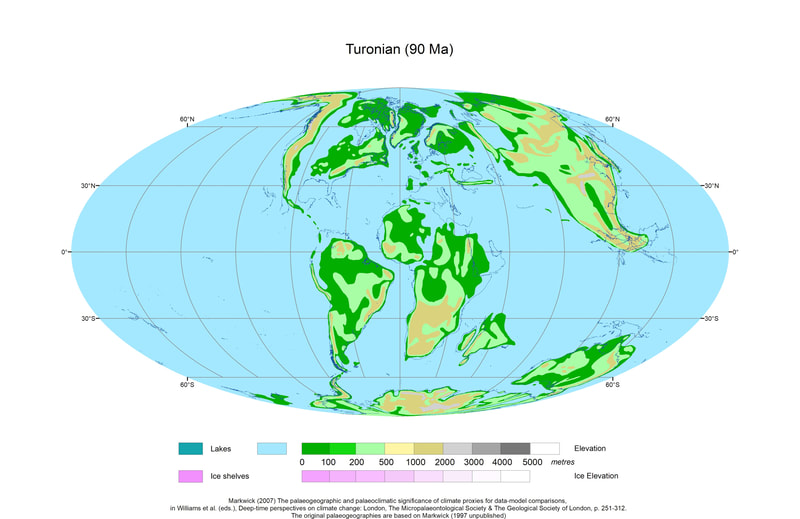
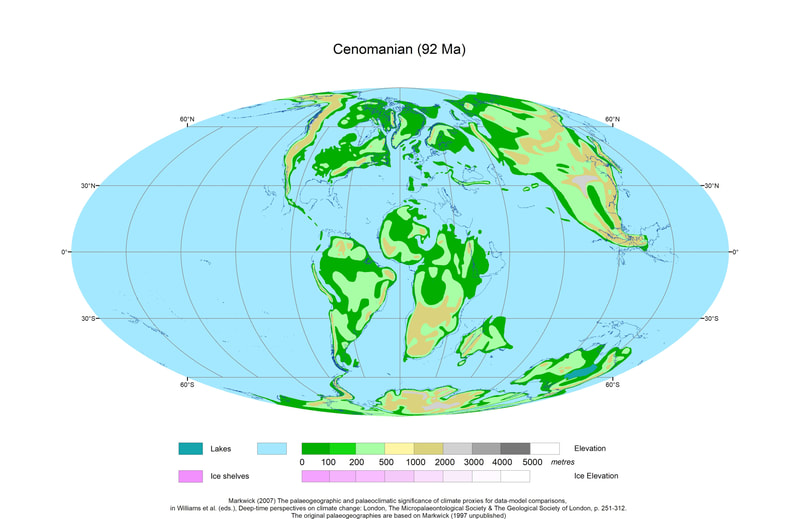
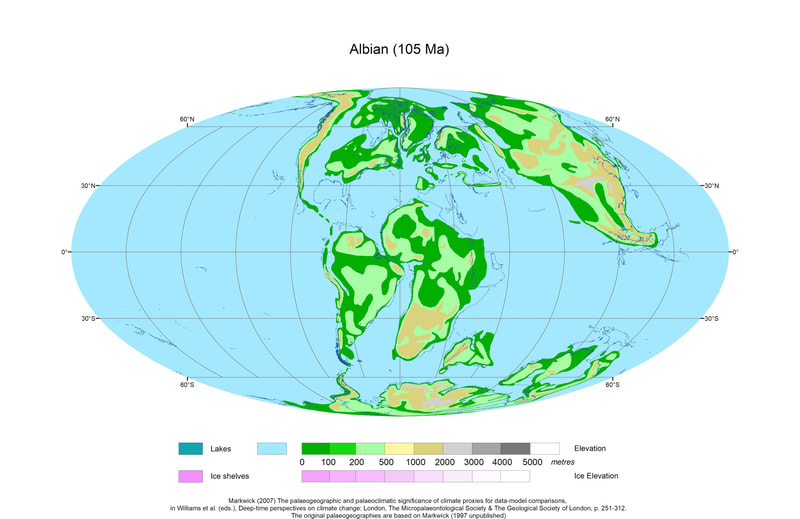
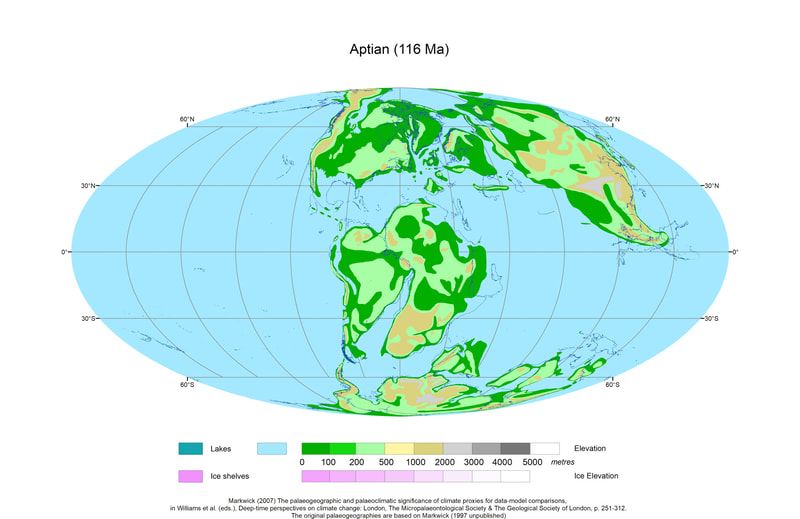
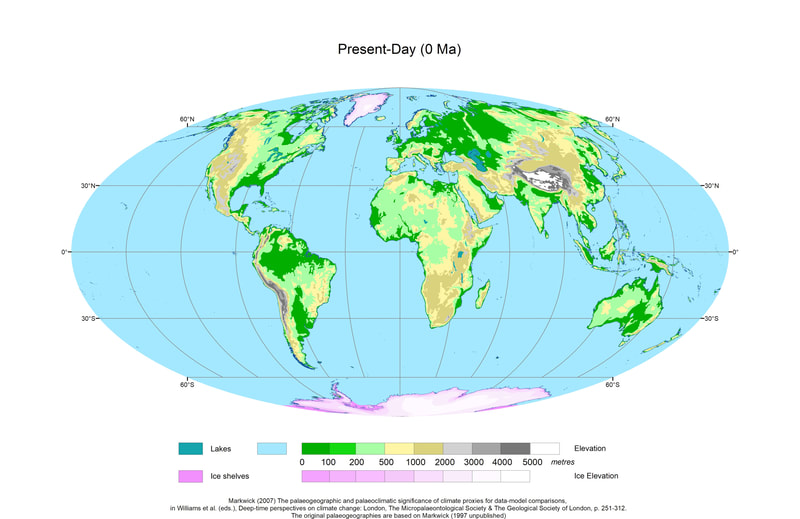
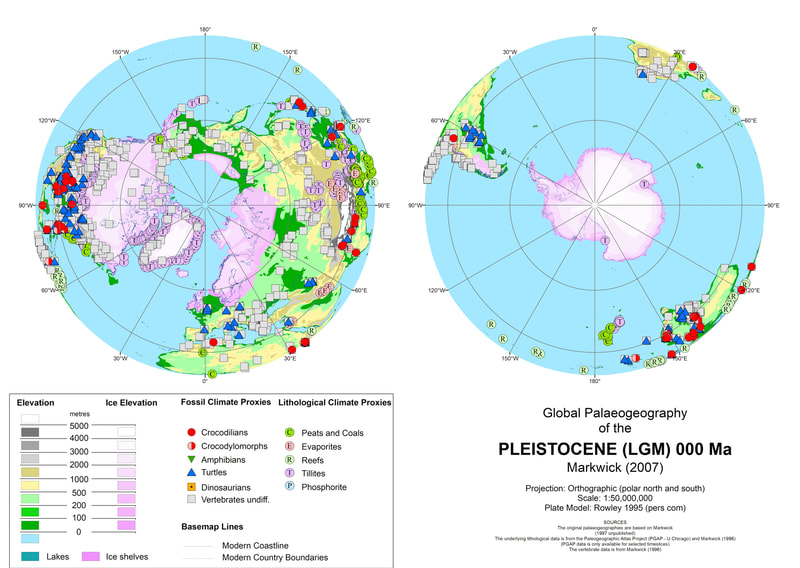
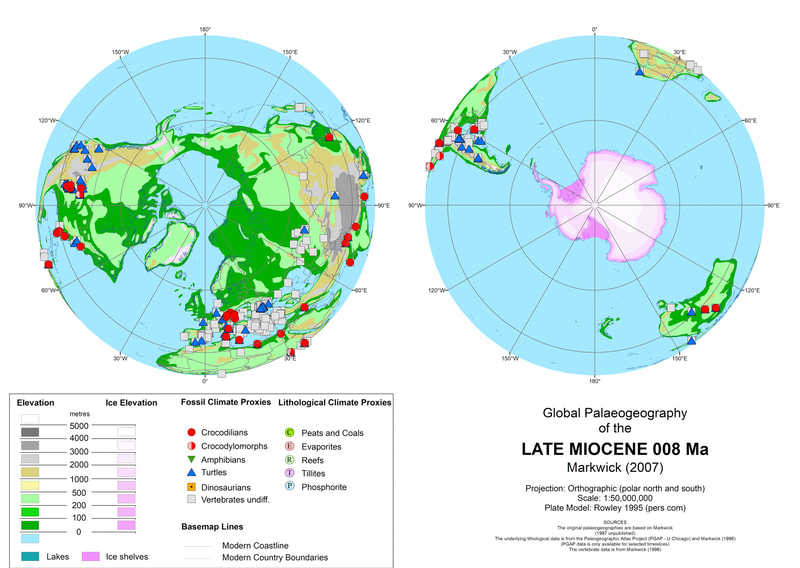
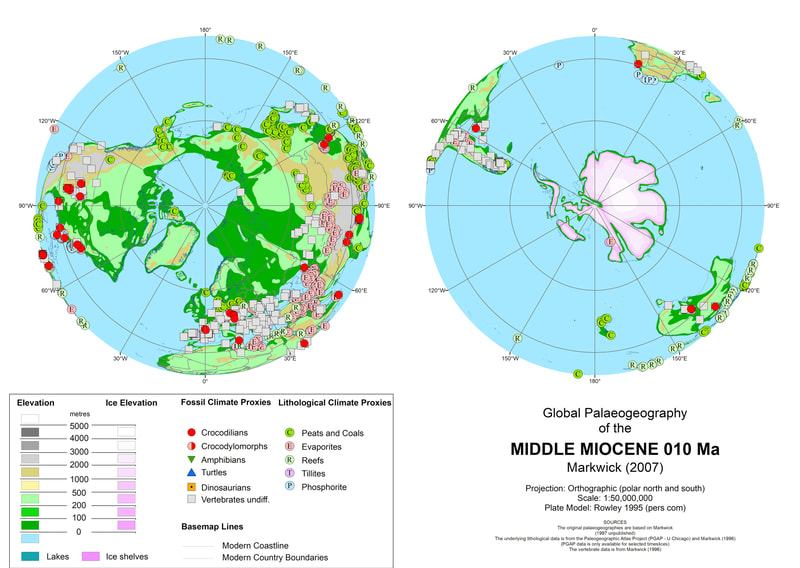
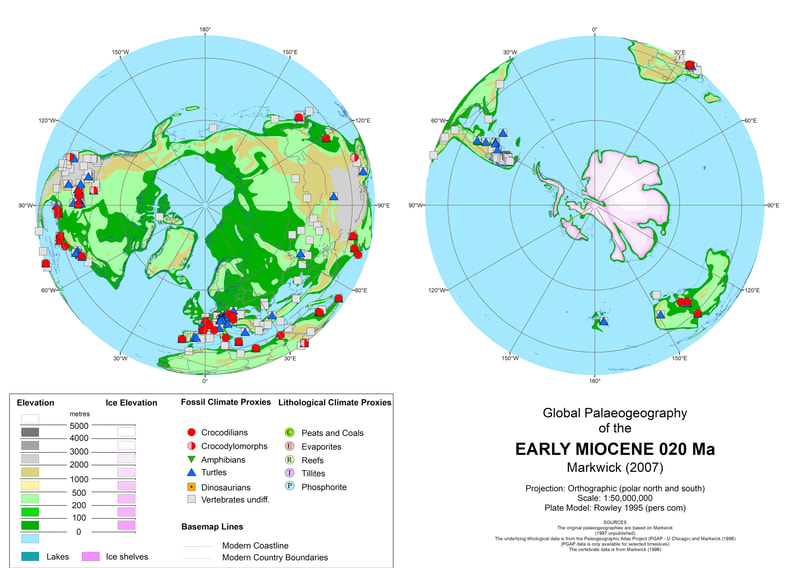
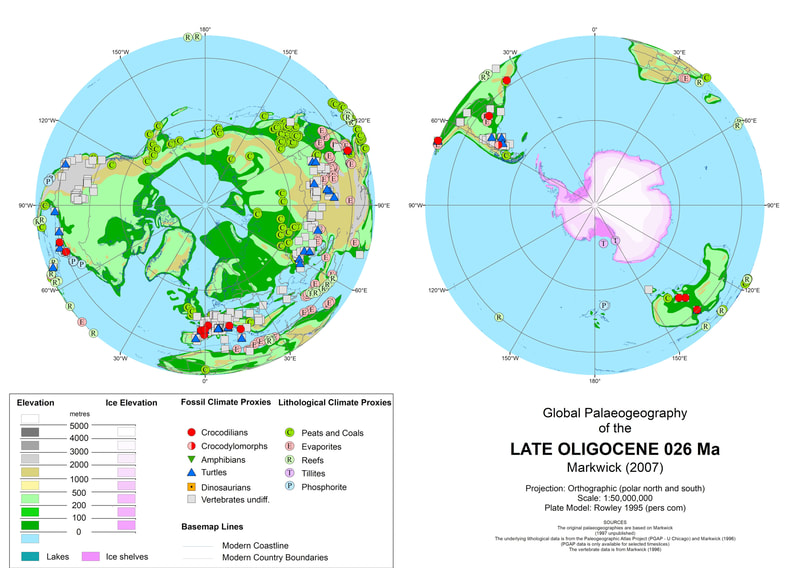
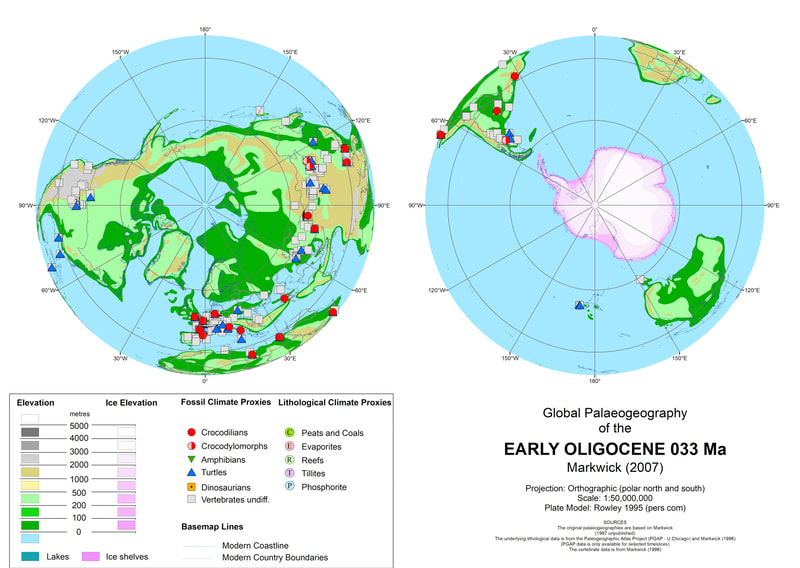
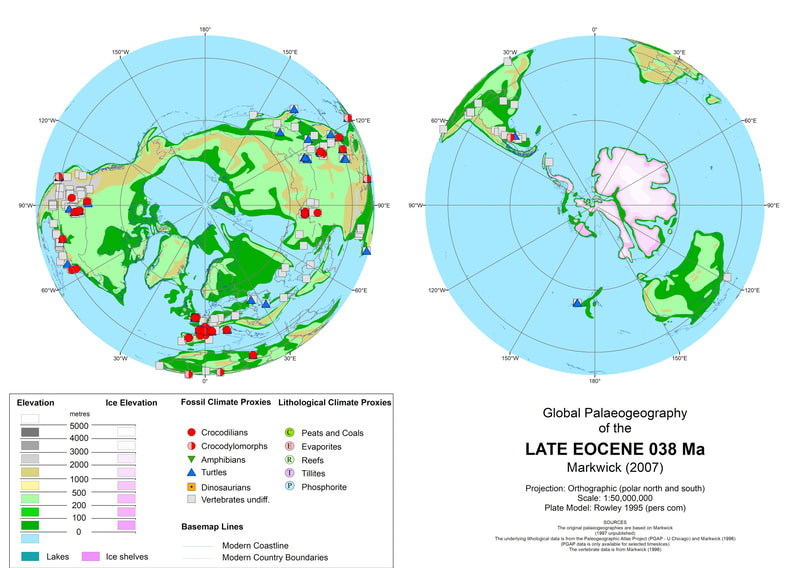
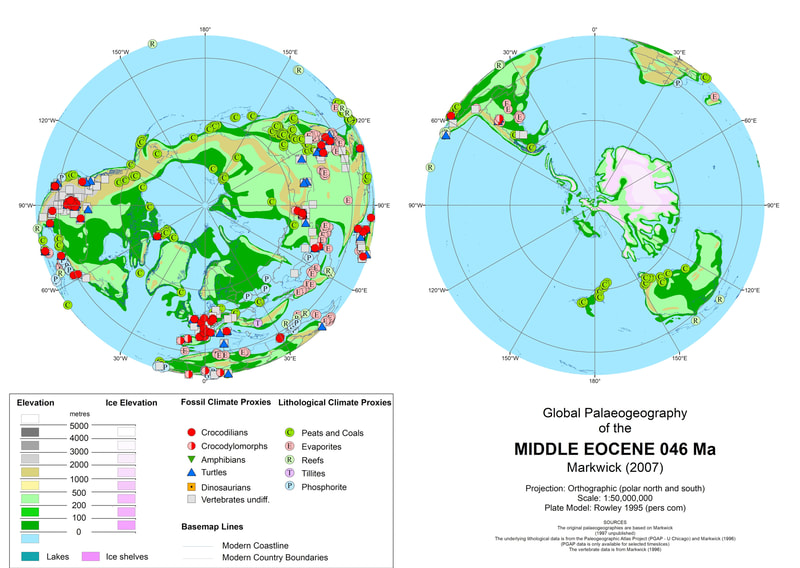
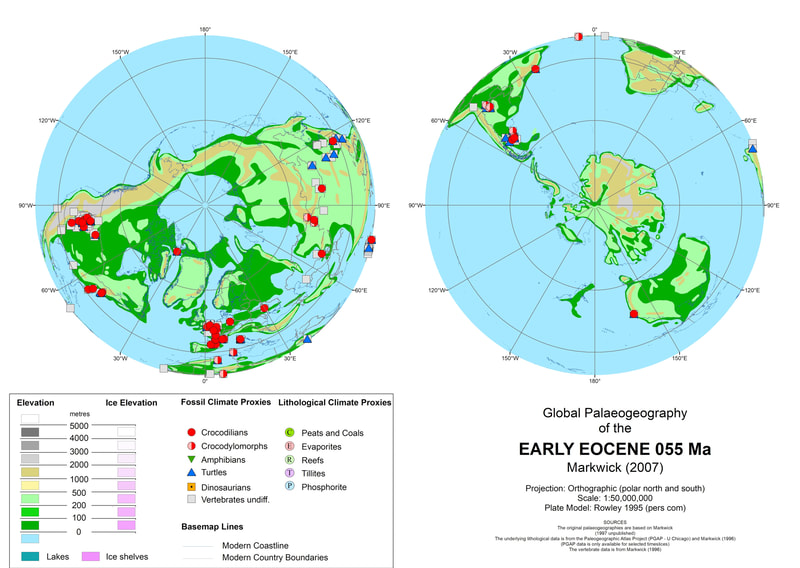
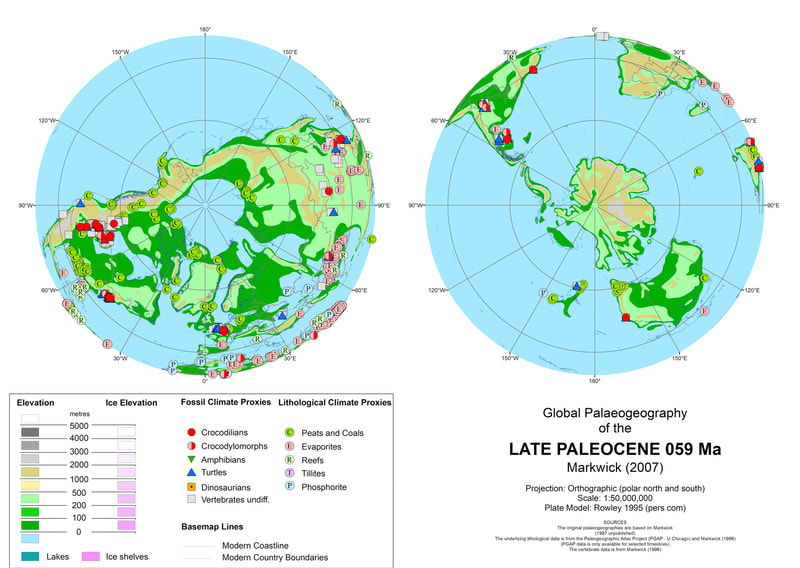
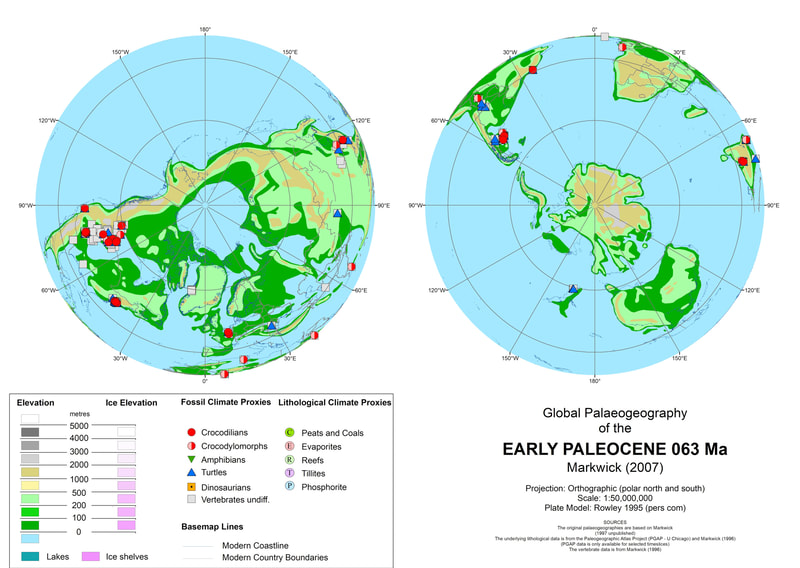
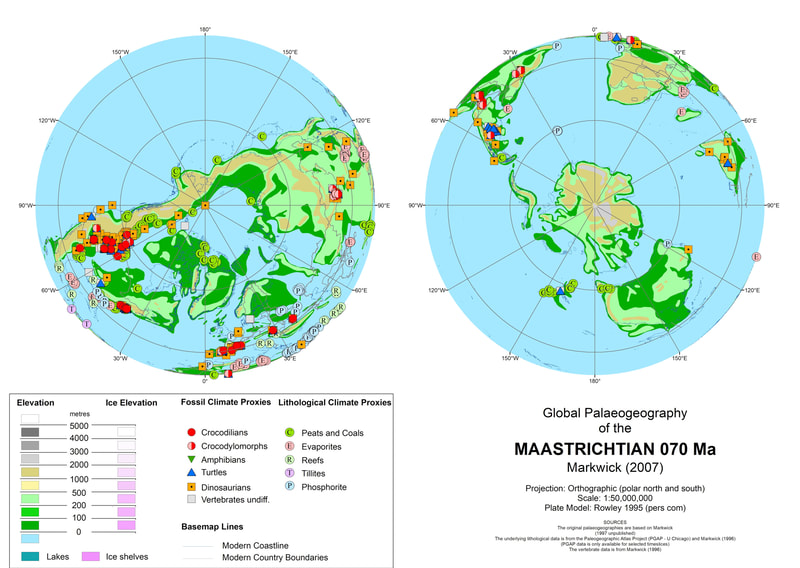
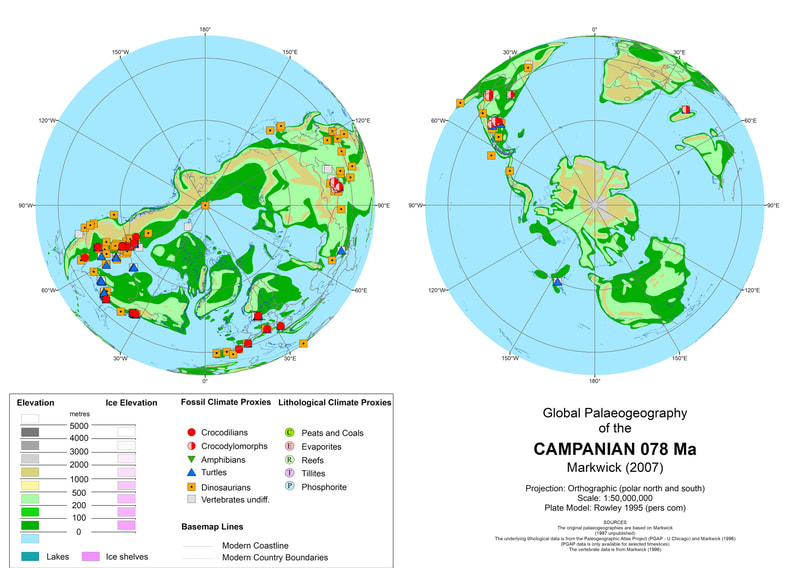
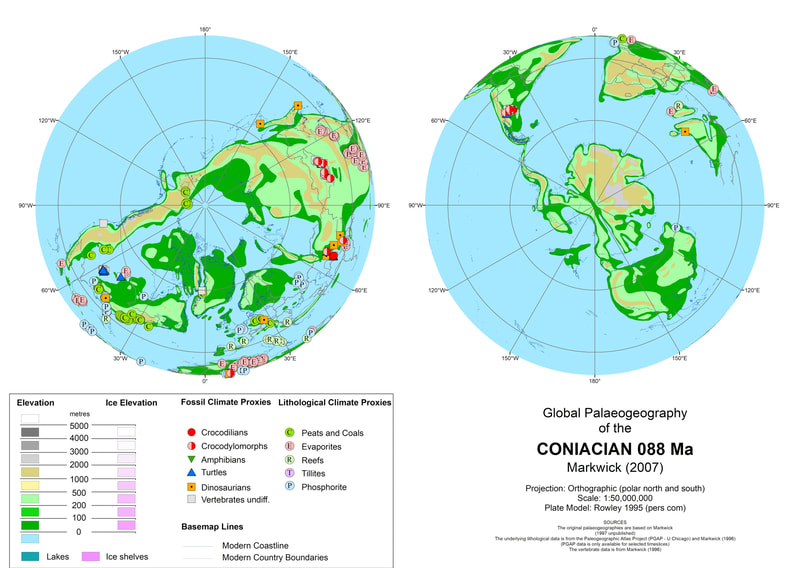
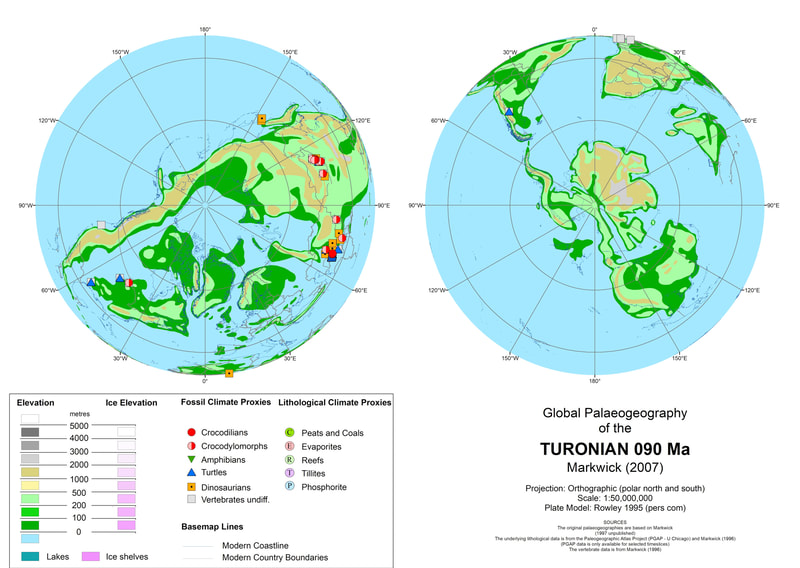
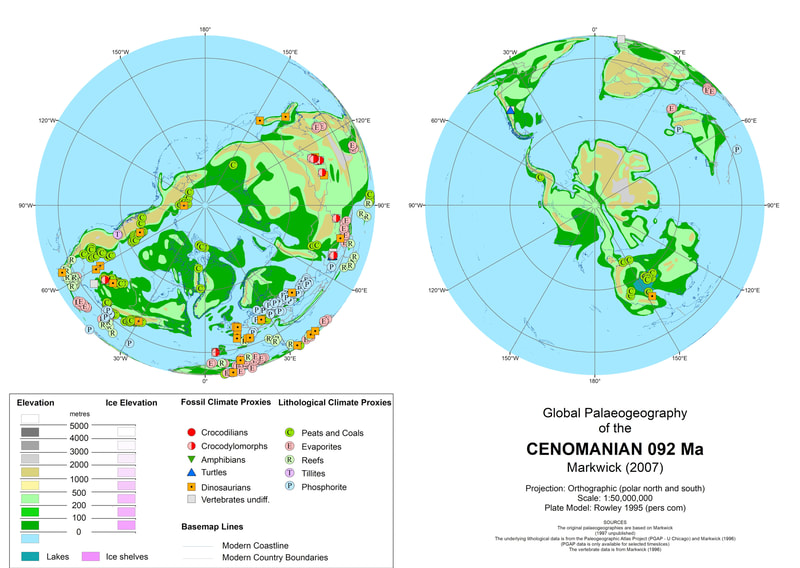
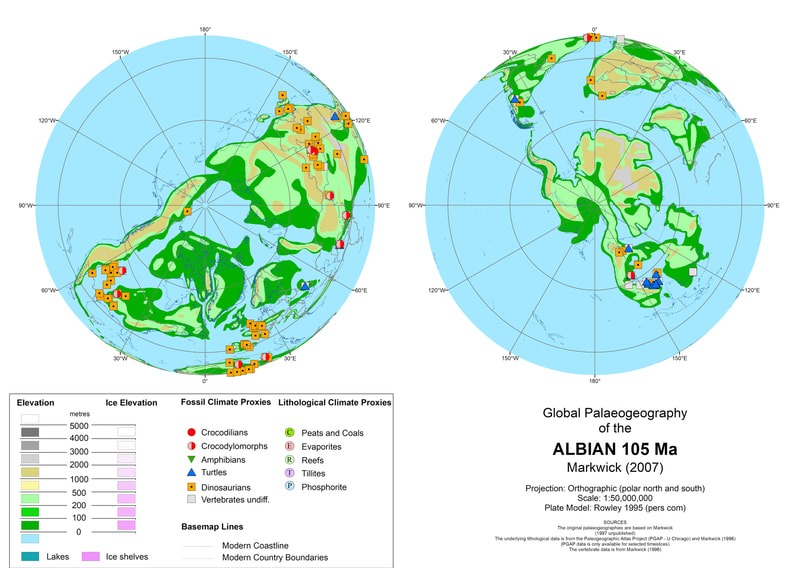
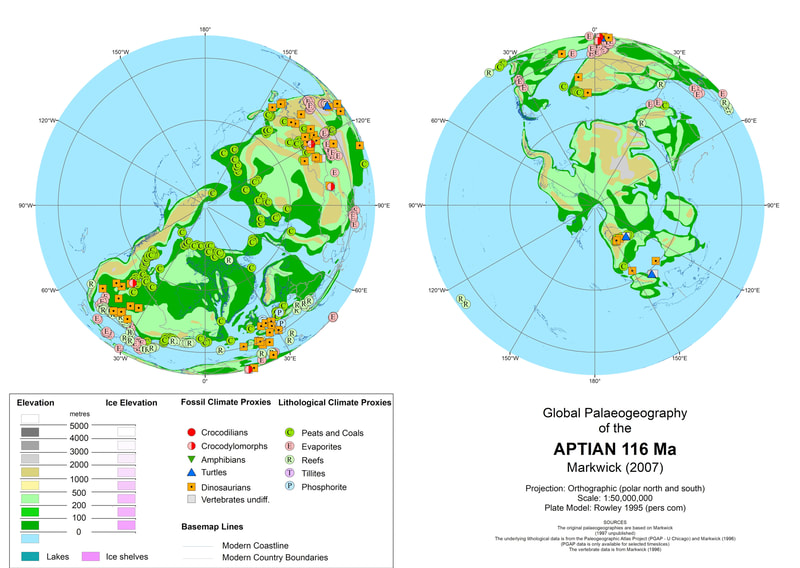
Paleogeography Maps (based on Markwick 2007)
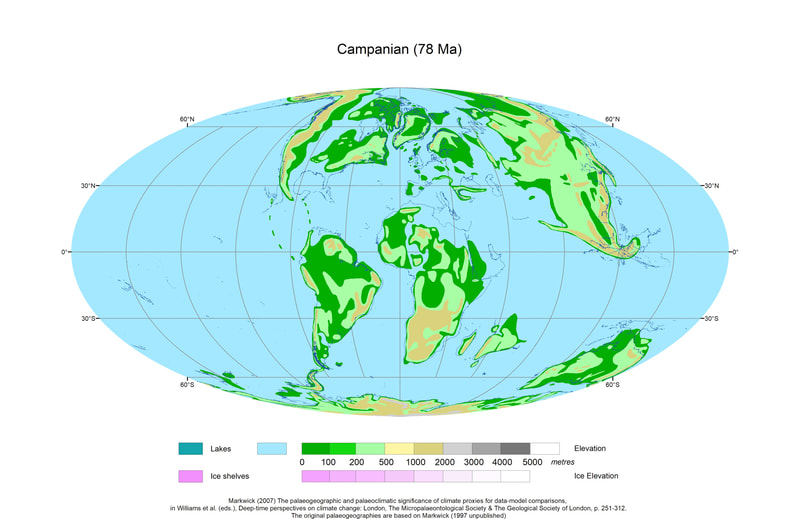
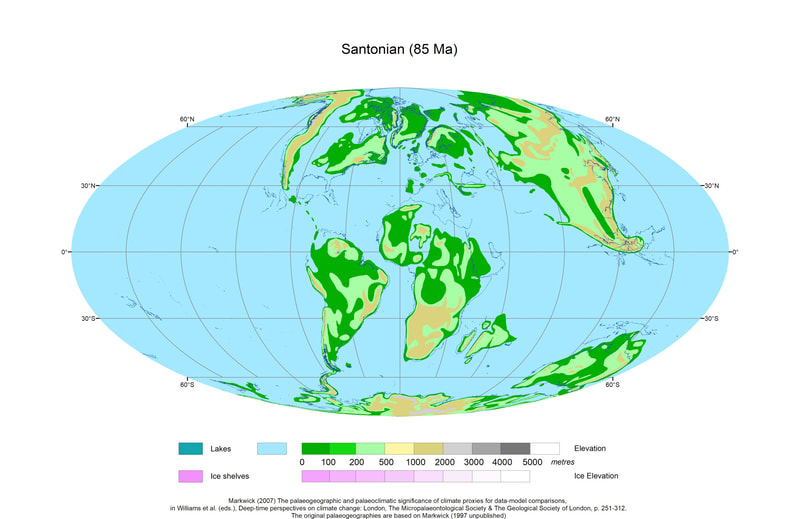
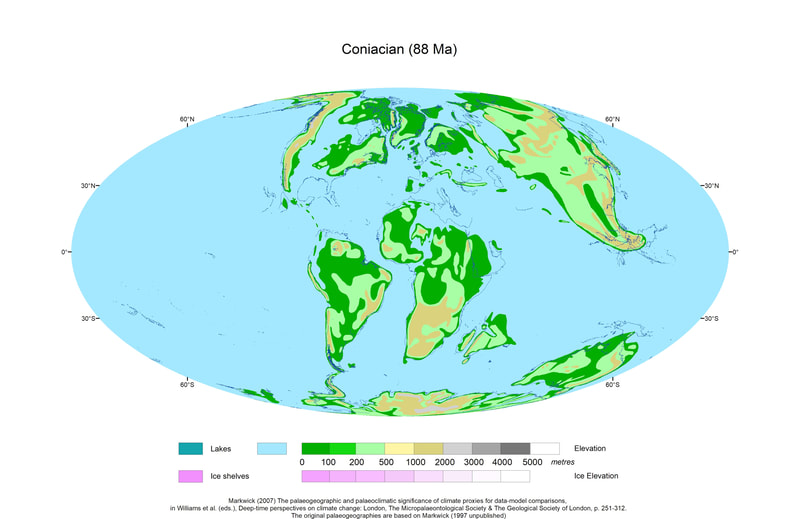
The following maps were originally published in Markwick (2007) although the work actually dates back to 1997.
The 2007 paper was focussed on climate proxies and so the polar projection maps reproduced here show the distribution of some of that data. If you would like further information on any of this please contact Paul at [email protected]
If you use any of these images the best citation is Markwick (2007). Markwick, P. J., 2007, The palaeogeographic and palaeoclimatic significance of climate proxies for data-model comparisons, in Williams, M., Haywood, A. M., Gregory, F. J., and Schmidt, D. N., eds., Deep-time perspectives on climate change: London, The Micropalaeontological Society & The Geological Society of London, p. 251-312.
If you would like to use them for commercial purposes please contact us directly at [email protected]

